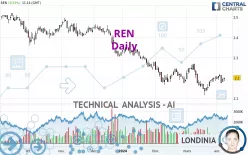
REN - Daily - Technical analysis published on 04/09/2024 (GMT)
- 93
- 0
Click here for a new analysis!
- Timeframe : Daily
- - Analysis generated on
- Status : INVALID

Summary of the analysis

Additional analysis
Quotes
The REN rating is 2.200 EUR. On the day, this instrument gained +0.23% and was traded between 2.185 EUR and 2.200 EUR over the period. The price is currently at +0.69% from its lowest and 0% from its highest.So that you have an overall view of the price change, here is a table showing the variations over several periods:
Near a new LOW record (1 year)
Type : Bearish
Timeframe : Weekly
Near a new LOW record (1st january)
Type : Bearish
Timeframe : Weekly
Near a new HIGH record (1 month)
Type : Bullish
Timeframe : Weekly
Technical
A technical analysis in Daily of this REN chart shows a bearish trend. 75.00% of the signals given by moving averages are bearish. Caution: the neutral signals currently given by short-term moving averages show us that the global trend is losing momentum. The Central Indicators scanner does not detect any result on moving averages that would impact this trend.
In fact, according to the parameters integrated into the Central Analyzer system, 11 technical indicators out of 18 analysed are currently bullish. Caution: the Central Indicators scanner currently detects an excess:
Williams %R indicator is overbought : over -20
Type : Neutral
Timeframe : Daily
RSI indicator is back over 50
Type : Bullish
Timeframe : Daily
Price is back over the pivot point
Type : Bullish
Timeframe : Weekly
The analysis of the price chart with Central Patterns scanners does not return any result.
No result was found by the Central Candlesticks scanner on Japanese candlesticks.
| S3 | S2 | S1 | Price | R1 | R2 | R3 | |
|---|---|---|---|---|---|---|---|
| ProTrendLines | 1.950 | 2.135 | 2.189 | 2.200 | 2.265 | 2.309 | 2.417 |
| Change (%) | -11.36% | -2.95% | -0.50% | - | +2.95% | +4.95% | +9.86% |
| Change | -0.250 | -0.065 | -0.011 | - | +0.065 | +0.109 | +0.217 |
| Level | Intermediate | Minor | Major | - | Intermediate | Major | Intermediate |
Pivot points can also be used to set your price objectives. Here is the price situation in relation to pivot points:
| Pivot points | S3 | S2 | S1 | PP | R1 | R2 | R3 |
|---|---|---|---|---|---|---|---|
| Standard | 2.163 | 2.172 | 2.183 | 2.192 | 2.203 | 2.212 | 2.223 |
| Camarilla | 2.190 | 2.191 | 2.193 | 2.195 | 2.197 | 2.199 | 2.201 |
| Woodie | 2.165 | 2.173 | 2.185 | 2.193 | 2.205 | 2.213 | 2.225 |
| Fibonacci | 2.172 | 2.179 | 2.184 | 2.192 | 2.199 | 2.204 | 2.212 |
| Pivot points | S3 | S2 | S1 | PP | R1 | R2 | R3 |
|---|---|---|---|---|---|---|---|
| Standard | 2.115 | 2.145 | 2.160 | 2.190 | 2.205 | 2.235 | 2.250 |
| Camarilla | 2.163 | 2.167 | 2.171 | 2.175 | 2.179 | 2.183 | 2.187 |
| Woodie | 2.108 | 2.141 | 2.153 | 2.186 | 2.198 | 2.231 | 2.243 |
| Fibonacci | 2.145 | 2.162 | 2.173 | 2.190 | 2.207 | 2.218 | 2.235 |
| Pivot points | S3 | S2 | S1 | PP | R1 | R2 | R3 |
|---|---|---|---|---|---|---|---|
| Standard | 1.965 | 2.040 | 2.120 | 2.195 | 2.275 | 2.350 | 2.430 |
| Camarilla | 2.157 | 2.172 | 2.186 | 2.200 | 2.214 | 2.228 | 2.243 |
| Woodie | 1.968 | 2.041 | 2.123 | 2.196 | 2.278 | 2.351 | 2.433 |
| Fibonacci | 2.040 | 2.099 | 2.136 | 2.195 | 2.254 | 2.291 | 2.350 |
Numerical data
The following is the status of technical indicators and moving averages registered at the time this technical analysis was created:
| RSI (14): | 50.90 | |
| MACD (12,26,9): | -0.0030 | |
| Directional Movement: | -7.274 | |
| AROON (14): | 71.428 | |
| DEMA (21): | 2.186 | |
| Parabolic SAR (0,02-0,02-0,2): | 2.144 | |
| Elder Ray (13): | -0.001 | |
| Super Trend (3,10): | 2.221 | |
| Zig ZAG (10): | 2.200 | |
| VORTEX (21): | 0.8740 | |
| Stochastique (14,3,5): | 71.43 | |
| TEMA (21): | 2.196 | |
| Williams %R (14): | -19.05 | |
| Chande Momentum Oscillator (20): | 0.050 | |
| Repulse (5,40,3): | 0.2720 | |
| ROCnROLL: | -1 | |
| TRIX (15,9): | -0.0500 | |
| Courbe Coppock: | 2.63 |
| MA7: | 2.199 | |
| MA20: | 2.181 | |
| MA50: | 2.205 | |
| MA100: | 2.271 | |
| MAexp7: | 2.195 | |
| MAexp20: | 2.193 | |
| MAexp50: | 2.215 | |
| MAexp100: | 2.258 | |
| Price / MA7: | +0.05% | |
| Price / MA20: | +0.87% | |
| Price / MA50: | -0.23% | |
| Price / MA100: | -3.13% | |
| Price / MAexp7: | +0.23% | |
| Price / MAexp20: | +0.32% | |
| Price / MAexp50: | -0.68% | |
| Price / MAexp100: | -2.57% |
News
The latest news and videos published on REN at the time of the analysis were as follows:
- ANNOUNCEMENT OF 2023 ANNUAL RESULTS OF TONG REN TANG TECHNOLOGIES
- Flash News: OKG Technology Chairman Jeff Ren Outlines the Future of Web3 at Economist Impact's Technology for Change Asia 2024
- Flash News: OKG Technology Chairman Jeff Ren to Speak at Economist Impact's Technology for Change Asia Event in Hong Kong
- Flash News: OKG Technology Chairman Jeff Ren to Speak at Economist Impact's Technology for Change Asia Event in Hong Kong
- Xinhua Silk Road: Pien Tze Huang, Beijing Tong Ren Tang agree to boost bilateral cooperation, promote high-quality development of TCM
About author
Online


Add a comment
Comments
0 comments on the analysis REN - Daily