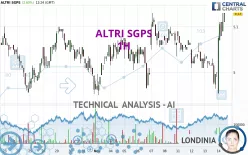
ALTRI SGPS - 1H - Technical analysis published on 11/14/2024 (GMT)
- 76
- 0
Click here for a new analysis!
- Timeframe : 1H
- - Analysis generated on
- Status : TARGET REACHED

Summary of the analysis

Additional analysis
Quotes
The ALTRI SGPS rating is 5.130 EUR. The price registered an increase of +2.60% on the session and was traded between 4.954 EUR and 5.130 EUR over the period. The price is currently at +3.55% from its lowest and 0% from its highest.The Central Gaps scanner detects the formation of a bearish gap marking the strong presence of sellers ahead of buyers at the opening. This formed a quotation gap.
Opening Gap DOWN
Type : Bearish
Timeframe : Openning
A study of price movements over other periods shows the following variations:
Near a new HIGH record (1 month)
Type : Bullish
Timeframe : Weekly
Technical
Technical analysis of ALTRI SGPS in 1H shows a strongly overall bullish trend. 82.14% of the signals given by moving averages are bullish. The overall trend is supported by the strong bullish signals from short-term moving averages. The Central Indicators scanner does not detect any result on moving averages that would impact this trend.
In fact, according to the parameters integrated into the Central Analyzer system, 14 technical indicators out of 18 analysed are currently bullish. Caution: the Central Indicators scanner currently detects an excess:
CCI indicator is overbought : over 100
Type : Neutral
Timeframe : 1 hour
CCI indicator: bearish divergence
Type : Bearish
Timeframe : 1 hour
Williams %R indicator is overbought : over -20
Type : Neutral
Timeframe : 1 hour
Pivot points : price is over resistance 3
Type : Neutral
Timeframe : 1 hour
The Central Patterns scanner, which studies chart patterns, resistances and supports, has identified these signals:
Near horizontal resistance
Type : Bearish
Timeframe : 1 hour
Resistance of channel is broken
Type : Bullish
Timeframe : 1 hour
The Central Candlesticks scanner, specialised in Japanese candlesticks, did not identify any signals.
| S3 | S2 | S1 | Price | R1 | R2 | R3 | |
|---|---|---|---|---|---|---|---|
| ProTrendLines | 5.010 | 5.065 | 5.100 | 5.130 | 5.183 | 5.512 | 5.944 |
| Change (%) | -2.34% | -1.27% | -0.58% | - | +1.03% | +7.45% | +15.87% |
| Change | -0.120 | -0.065 | -0.030 | - | +0.053 | +0.382 | +0.814 |
| Level | Intermediate | Minor | Intermediate | - | Major | Major | Minor |
Pivot points can also be used to set your price objectives. Here is the price situation in relation to pivot points:
| Pivot points | S3 | S2 | S1 | PP | R1 | R2 | R3 |
|---|---|---|---|---|---|---|---|
| Standard | 4.887 | 4.925 | 4.963 | 5.001 | 5.039 | 5.077 | 5.115 |
| Camarilla | 4.979 | 4.986 | 4.993 | 5.000 | 5.007 | 5.014 | 5.021 |
| Woodie | 4.886 | 4.925 | 4.962 | 5.001 | 5.038 | 5.077 | 5.114 |
| Fibonacci | 4.925 | 4.954 | 4.972 | 5.001 | 5.030 | 5.048 | 5.077 |
| Pivot points | S3 | S2 | S1 | PP | R1 | R2 | R3 |
|---|---|---|---|---|---|---|---|
| Standard | 4.807 | 4.885 | 4.973 | 5.051 | 5.139 | 5.217 | 5.305 |
| Camarilla | 5.014 | 5.030 | 5.045 | 5.060 | 5.075 | 5.090 | 5.106 |
| Woodie | 4.811 | 4.888 | 4.977 | 5.054 | 5.143 | 5.220 | 5.309 |
| Fibonacci | 4.885 | 4.949 | 4.988 | 5.051 | 5.115 | 5.154 | 5.217 |
| Pivot points | S3 | S2 | S1 | PP | R1 | R2 | R3 |
|---|---|---|---|---|---|---|---|
| Standard | 4.529 | 4.741 | 4.857 | 5.069 | 5.185 | 5.397 | 5.513 |
| Camarilla | 4.884 | 4.914 | 4.944 | 4.974 | 5.004 | 5.034 | 5.064 |
| Woodie | 4.482 | 4.717 | 4.810 | 5.045 | 5.138 | 5.373 | 5.466 |
| Fibonacci | 4.741 | 4.866 | 4.943 | 5.069 | 5.194 | 5.271 | 5.397 |
Numerical data
The following is the status of technical indicators and moving averages registered at the time this technical analysis was created:
| RSI (14): | 64.90 | |
| MACD (12,26,9): | 0.0120 | |
| Directional Movement: | 16.055 | |
| AROON (14): | 21.428 | |
| DEMA (21): | 5.063 | |
| Parabolic SAR (0,02-0,02-0,2): | 4.970 | |
| Elder Ray (13): | 0.054 | |
| Super Trend (3,10): | 5.023 | |
| Zig ZAG (10): | 5.120 | |
| VORTEX (21): | 1.1090 | |
| Stochastique (14,3,5): | 87.91 | |
| TEMA (21): | 5.079 | |
| Williams %R (14): | -5.68 | |
| Chande Momentum Oscillator (20): | 0.085 | |
| Repulse (5,40,3): | 0.9610 | |
| ROCnROLL: | 1 | |
| TRIX (15,9): | -0.0070 | |
| Courbe Coppock: | 1.77 |
| MA7: | 5.045 | |
| MA20: | 5.049 | |
| MA50: | 5.030 | |
| MA100: | 5.044 | |
| MAexp7: | 5.081 | |
| MAexp20: | 5.053 | |
| MAexp50: | 5.049 | |
| MAexp100: | 5.052 | |
| Price / MA7: | +1.68% | |
| Price / MA20: | +1.60% | |
| Price / MA50: | +1.99% | |
| Price / MA100: | +1.70% | |
| Price / MAexp7: | +0.96% | |
| Price / MAexp20: | +1.52% | |
| Price / MAexp50: | +1.60% | |
| Price / MAexp100: | +1.54% |
About author
Online


Add a comment
Comments
0 comments on the analysis ALTRI SGPS - 1H