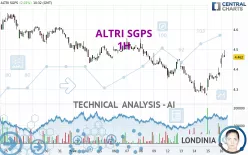
ALTRI SGPS - 1H - Technical analysis published on 02/16/2024 (GMT)
- 114
- 0
Click here for a new analysis!
- Timeframe : 1H
- - Analysis generated on
- Status : TARGET REACHED

Summary of the analysis

Additional analysis
Quotes
The ALTRI SGPS price is 4.470 EUR. The price has increased by +2.20% since the last closing and was between 4.408 EUR and 4.496 EUR. This implies that the price is at +1.41% from its lowest and at -0.58% from its highest.The Central Gaps scanner detects the formation of a bullish gap marking the strong presence of buyers against sellers at the opening. This formed a quotation gap.
Opening Gap UP
Type : Bullish
Timeframe : Openning
Here is a more detailed summary of the historical variations registered by ALTRI SGPS:
Near a new LOW record (1st january)
Type : Bearish
Timeframe : Weekly
Near a new HIGH record (1 month)
Type : Bullish
Timeframe : Weekly
Technical
Technical analysis of ALTRI SGPS in 1H shows an overall slightly bullish trend. Only 60.71% of the signals given by moving averages are bullish. This slightly bullish trend is reinforced by the strong signals currently being given by short-term moving averages. The Central Indicators market scanner currently does not detect any result that concerns moving averages.
The probability of a further increase is high given the direction of the technical indicators.
Caution: the Central Indicators scanner currently detects an excess:
RSI indicator is overbought : over 70
Type : Neutral
Timeframe : 1 hour
CCI indicator is overbought : over 100
Type : Neutral
Timeframe : 1 hour
Williams %R indicator is overbought : over -20
Type : Neutral
Timeframe : 1 hour
Pivot points : price is over resistance 2
Type : Neutral
Timeframe : 1 hour
Price is back over the pivot point
Type : Bullish
Timeframe : Weekly
The Central Patterns scanner, which studies chart patterns, resistances and supports, has identified these signals:
Near horizontal resistance
Type : Bearish
Timeframe : 1 hour
Resistance of channel is broken
Type : Bullish
Timeframe : 1 hour
The Central Candlesticks scanner currently notes the presence of this pattern in Japanese candlesticks that could mark the end of the short-term trend currently underway:
White gravestone / inverted hammer
Type : Neutral
Timeframe : 1 hour
| S3 | S2 | S1 | Price | R1 | R2 | R3 | |
|---|---|---|---|---|---|---|---|
| ProTrendLines | 4.334 | 4.370 | 4.427 | 4.470 | 4.553 | 4.613 | 4.674 |
| Change (%) | -3.04% | -2.24% | -0.96% | - | +1.86% | +3.20% | +4.56% |
| Change | -0.136 | -0.100 | -0.043 | - | +0.083 | +0.143 | +0.204 |
| Level | Minor | Major | Major | - | Major | Minor | Major |
To determine price objectives, it is also possible to use the pivot points. Here is the price position in relation to pivot points:
| Pivot points | S3 | S2 | S1 | PP | R1 | R2 | R3 |
|---|---|---|---|---|---|---|---|
| Standard | 4.195 | 4.245 | 4.309 | 4.359 | 4.423 | 4.473 | 4.537 |
| Camarilla | 4.343 | 4.353 | 4.364 | 4.374 | 4.385 | 4.395 | 4.405 |
| Woodie | 4.203 | 4.249 | 4.317 | 4.363 | 4.431 | 4.477 | 4.545 |
| Fibonacci | 4.245 | 4.288 | 4.315 | 4.359 | 4.402 | 4.429 | 4.473 |
| Pivot points | S3 | S2 | S1 | PP | R1 | R2 | R3 |
|---|---|---|---|---|---|---|---|
| Standard | 4.199 | 4.301 | 4.351 | 4.453 | 4.503 | 4.605 | 4.655 |
| Camarilla | 4.360 | 4.374 | 4.388 | 4.402 | 4.416 | 4.430 | 4.444 |
| Woodie | 4.174 | 4.288 | 4.326 | 4.440 | 4.478 | 4.592 | 4.630 |
| Fibonacci | 4.301 | 4.359 | 4.395 | 4.453 | 4.511 | 4.547 | 4.605 |
| Pivot points | S3 | S2 | S1 | PP | R1 | R2 | R3 |
|---|---|---|---|---|---|---|---|
| Standard | 4.019 | 4.195 | 4.357 | 4.533 | 4.695 | 4.871 | 5.033 |
| Camarilla | 4.427 | 4.458 | 4.489 | 4.520 | 4.551 | 4.582 | 4.613 |
| Woodie | 4.013 | 4.192 | 4.351 | 4.530 | 4.689 | 4.868 | 5.027 |
| Fibonacci | 4.195 | 4.324 | 4.404 | 4.533 | 4.662 | 4.742 | 4.871 |
Numerical data
The following are the details of the technical indicators and moving averages that were collected to generate this technical analysis:
| RSI (14): | 71.16 | |
| MACD (12,26,9): | 0.0200 | |
| Directional Movement: | 26.853 | |
| AROON (14): | 85.714 | |
| DEMA (21): | 4.399 | |
| Parabolic SAR (0,02-0,02-0,2): | 4.337 | |
| Elder Ray (13): | 0.087 | |
| Super Trend (3,10): | 4.385 | |
| Zig ZAG (10): | 4.486 | |
| VORTEX (21): | 1.0880 | |
| Stochastique (14,3,5): | 91.82 | |
| TEMA (21): | 4.433 | |
| Williams %R (14): | -7.97 | |
| Chande Momentum Oscillator (20): | 0.202 | |
| Repulse (5,40,3): | 0.1990 | |
| ROCnROLL: | 1 | |
| TRIX (15,9): | -0.0020 | |
| Courbe Coppock: | 5.29 |
| MA7: | 4.391 | |
| MA20: | 4.490 | |
| MA50: | 4.560 | |
| MA100: | 4.548 | |
| MAexp7: | 4.423 | |
| MAexp20: | 4.381 | |
| MAexp50: | 4.390 | |
| MAexp100: | 4.427 | |
| Price / MA7: | +1.80% | |
| Price / MA20: | -0.45% | |
| Price / MA50: | -1.97% | |
| Price / MA100: | -1.72% | |
| Price / MAexp7: | +1.06% | |
| Price / MAexp20: | +2.03% | |
| Price / MAexp50: | +1.82% | |
| Price / MAexp100: | +0.97% |
About author
Online


Add a comment
Comments
0 comments on the analysis ALTRI SGPS - 1H