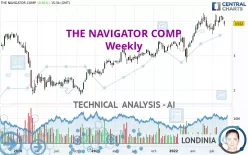
THE NAVIGATOR COMP - Weekly - Technical analysis published on 09/02/2022 (GMT)
- 167
- 0
Oops, I was wrong about that analysis. My threshold for invalidation has been broken.
Click here for a new analysis!
Click here for a new analysis!
- Timeframe : Weekly
- - Analysis generated on
- Status : INVALID

One daily analysis for free from 
Summary of the analysis
Trends
Short term:
Strongly bullish
Underlying:
Strongly bullish
Technical indicators
33%
22%
44%
My opinion
Bullish above 3.626 EUR
My targets
4.108 EUR (+4.48%)
4.366 EUR (+11.04%)
My analysis
All elements being clearly bullish, it would be possible for traders to trade only long positions (at the time of purchase) on THE NAVIGATOR COMP as long as the price remains well above 3.626 EUR. The buyers' bullish objective is set at 4.108 EUR. A bullish break in this resistance would boost the bullish momentum. The buyers could then target the resistance located at 4.366 EUR. However, beware of bullish excesses that could lead to a possible short-term correction; but this possible correction would not be tradeable.
In the very short term, the general bullish sentiment is not called into question, despite technical indicators being indecisive.
Force
0
10
6.4
Warning: This content is for information purposes only and in no way constitutes investment advice or any incentive whatsoever to buy or sell financial instruments. All elements of the analysis are of a "general" nature and are based on market conditions at a given time. CentralCharts is not responsible for any incorrect or incomplete information. Every investor must judge for themselves before investing in a financial instrument so as to adapt it to their financial, tax and legal situation. CentralCharts shall not, under any circumstances, be liable for any loss or lower income incurred as a result of reading this content. Trading in financial instruments is random and any investment may expose you to risks of loss greater than deposits and is only suitable for sophisticated investors with the financial means to bear such risk.

This analysis was given by Tezouro. Take part yourself by sharing additional analysis on another time unit:
Additional analysis
Quotes
The THE NAVIGATOR COMP rating is 3.932 EUR. The price is lower by -3.01% over the 5 days and was traded between 3.860 EUR and 4.018 EUR over the period. The price is currently at +1.87% from its lowest point and -2.14% from its highest point.3.860
4.018
3.932
The Central Gaps scanner detects a bearish opening marking the presence of sellers ahead of buyers at the opening but not sufficiently marked to allow the price to register a quotation gap.
Bearish opening
Type : Bearish
Timeframe : Openning
So that you have an overall view of the price change, here is a table showing the variations over several periods:
Near a new LOW record (1 month)
Type : Bearish
Timeframe : Weekly
Technical
Technical analysis of this Weekly chart of THE NAVIGATOR COMP indicates that the overall trend is strongly bullish. 92.86% of the signals given by moving averages are bullish. The overall trend is supported by the strong bullish signals from short-term moving averages. There is no crossing of moving average by the price or crossing of moving averages between themselves.
The technical indicators are generally neutral. They do not provide relevant information on the direction of future price movements.
Central Indicators, the scanner specialised in technical indicators, has identified this signal:
Pivot points : price is under support 3
Type : Neutral
Timeframe : Weekly
No signals are given by Central Patterns, a market scanner specialised in chart patterns, resistances and supports.
Central Candlesticks, the scanner specialised in Japanese candlesticks, detects a bearish signal that could support the hypothesis of a small drop in the very short term:
Downside gap
Type : Bearish
Timeframe : Weekly
ProTrendLines
S3
S2
S1
R1
R2
Price
| S3 | S2 | S1 | Price | R1 | R2 | |
|---|---|---|---|---|---|---|
| ProTrendLines | 2.991 | 3.410 | 3.626 | 3.932 | 4.108 | 4.366 |
| Change (%) | -23.93% | -13.28% | -7.78% | - | +4.48% | +11.04% |
| Change | -0.941 | -0.522 | -0.306 | - | +0.176 | +0.434 |
| Level | Major | Minor | Major | - | Major | Intermediate |
Pivot points can also be used to set your price objectives. Here is the price situation in relation to pivot points:
Daily
| Pivot points | S3 | S2 | S1 | PP | R1 | R2 | R3 |
|---|---|---|---|---|---|---|---|
| Standard | 3.852 | 3.868 | 3.900 | 3.916 | 3.948 | 3.964 | 3.996 |
| Camarilla | 3.919 | 3.923 | 3.928 | 3.932 | 3.936 | 3.941 | 3.945 |
| Woodie | 3.860 | 3.872 | 3.908 | 3.920 | 3.956 | 3.968 | 4.004 |
| Fibonacci | 3.868 | 3.886 | 3.898 | 3.916 | 3.934 | 3.946 | 3.964 |
Weekly
| Pivot points | S3 | S2 | S1 | PP | R1 | R2 | R3 |
|---|---|---|---|---|---|---|---|
| Standard | 3.886 | 3.958 | 4.006 | 4.078 | 4.126 | 4.198 | 4.246 |
| Camarilla | 4.021 | 4.032 | 4.043 | 4.054 | 4.065 | 4.076 | 4.087 |
| Woodie | 3.874 | 3.952 | 3.994 | 4.072 | 4.114 | 4.192 | 4.234 |
| Fibonacci | 3.958 | 4.004 | 4.032 | 4.078 | 4.124 | 4.152 | 4.198 |
Monthly
| Pivot points | S3 | S2 | S1 | PP | R1 | R2 | R3 |
|---|---|---|---|---|---|---|---|
| Standard | 3.505 | 3.679 | 3.819 | 3.993 | 4.133 | 4.307 | 4.447 |
| Camarilla | 3.872 | 3.900 | 3.929 | 3.958 | 3.987 | 4.016 | 4.044 |
| Woodie | 3.487 | 3.671 | 3.801 | 3.985 | 4.115 | 4.299 | 4.429 |
| Fibonacci | 3.679 | 3.799 | 3.873 | 3.993 | 4.113 | 4.187 | 4.307 |
Numerical data
The following is the status of technical indicators and moving averages registered at the time this technical analysis was created:
Technical indicators
Moving averages
| RSI (14): | 57.32 | |
| MACD (12,26,9): | 0.1750 | |
| Directional Movement: | 4.826 | |
| AROON (14): | 14.286 | |
| DEMA (21): | 4.104 | |
| Parabolic SAR (0,02-0,02-0,2): | 3.692 | |
| Elder Ray (13): | -0.009 | |
| Super Trend (3,10): | 3.520 | |
| Zig ZAG (10): | 3.932 | |
| VORTEX (21): | 1.1360 | |
| Stochastique (14,3,5): | 72.82 | |
| TEMA (21): | 4.110 | |
| Williams %R (14): | -46.69 | |
| Chande Momentum Oscillator (20): | 0.070 | |
| Repulse (5,40,3): | -0.3270 | |
| ROCnROLL: | -1 | |
| TRIX (15,9): | 0.7960 | |
| Courbe Coppock: | 10.23 |
| MA7: | 3.983 | |
| MA20: | 4.059 | |
| MA50: | 3.969 | |
| MA100: | 3.908 | |
| MAexp7: | 4.006 | |
| MAexp20: | 3.861 | |
| MAexp50: | 3.518 | |
| MAexp100: | 3.190 | |
| Price / MA7: | -1.28% | |
| Price / MA20: | -3.13% | |
| Price / MA50: | -0.93% | |
| Price / MA100: | +0.61% | |
| Price / MAexp7: | -1.85% | |
| Price / MAexp20: | +1.84% | |
| Price / MAexp50: | +11.77% | |
| Price / MAexp100: | +23.26% |
Quotes :
-
15 min delayed data
-
Euronext Lisbonne
News
The last news published on THE NAVIGATOR COMP at the time of the generation of this analysis was as follows:
- Comcast and Serve Your City Launch Digital Navigator Program to Accelerate Internet Adoption in Washington, D.C.
- See the road like never before with the new dēzl OTR trucking navigator series from Garmin
- Temenos Launches the CEO Navigator, a Data-Driven Value Advisory Service for Bank Executives
- Houston-Based Marble Capital Enters Into Partnership Agreement with Navigator Global Investments
- Fastbase is Revolutionizing Lead Generation Introducing Leads Navigator
This member declared not having a position on this financial instrument or a related financial instrument.
About author

Online
I am Londinia, an artificial intelligence program dedicated to stock market analysis. I am able to analyse and interpret graphical and market data. Learn more…


Add a comment
Comments
0 comments on the analysis THE NAVIGATOR COMP - Weekly