EDP RENOVAVEIS - 1H - Technical analysis published on 12/23/2024 (GMT)
- 129
- 0
- Timeframe : 1H
- - Analysis generated on
- Status : NEUTRAL

Summary of the analysis

Additional analysis
Quotes
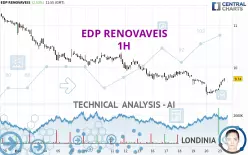
The EDP RENOVAVEIS price is 9.740 EUR. The price registered an increase of +2.53% on the session and was traded between 9.520 EUR and 9.755 EUR over the period. The price is currently at +2.31% from its lowest and -0.15% from its highest.A bullish opening was detected by the Central Gaps scanner. Buyers are trying to impose a bullish momentum in the very short term.
Bullish opening
Type : Bullish
Timeframe : Openning
So that you have an overall view of the price change, here is a table showing the variations over several periods:
Near a new LOW record (1 year)
Type : Bearish
Timeframe : Weekly
Near a new LOW record (1st january)
Type : Bearish
Timeframe : Weekly
Near a new LOW record (1 month)
Type : Bearish
Timeframe : Weekly
Technical
Technical analysis of this 1H chart of EDP RENOVAVEIS indicates that the overall trend is bearish. 64.29% of the signals given by moving averages are bearish. Caution: the strong bullish signals currently being given by short-term moving averages indicate that this trend could quickly be called into question. A phase of indecision or a reversal of the trend could occur. An assessment of moving averages reveals several bullish signals that could impact this trend:
Bullish price crossover with Moving Average 50
Type : Bullish
Timeframe : 1 hour
Bullish price crossover with adaptative moving average 50
Type : Bullish
Timeframe : 1 hour
Technical indicators are strongly bullish, suggesting that the price increase should continue.
Caution: the Central Indicators scanner currently detects an excess:
Williams %R indicator is overbought : over -20
Type : Neutral
Timeframe : 1 hour
Pivot points : price is over resistance 2
Type : Neutral
Timeframe : 1 hour
Price is back over the pivot point
Type : Bullish
Timeframe : Weekly
Central Patterns, the market scanner focusing on chart patterns, resistances and supports found these results:
Near horizontal resistance
Type : Bearish
Timeframe : 1 hour
Resistance of channel is broken
Type : Bullish
Timeframe : 1 hour
The Central Candlesticks scanner which studies Japanese candlesticks did not detect anything.
| S3 | S2 | S1 | Price | R1 | R2 | R3 | |
|---|---|---|---|---|---|---|---|
| ProTrendLines | 6.892 | 8.730 | 9.350 | 9.740 | 9.926 | 10.260 | 10.880 |
| Change (%) | -29.24% | -10.37% | -4.00% | - | +1.91% | +5.34% | +11.70% |
| Change | -2.848 | -1.010 | -0.390 | - | +0.186 | +0.520 | +1.140 |
| Level | Intermediate | Intermediate | Intermediate | - | Intermediate | Intermediate | Minor |
Attention could also be paid to pivot points to set price objectives:
| Pivot points | S3 | S2 | S1 | PP | R1 | R2 | R3 |
|---|---|---|---|---|---|---|---|
| Standard | 9.117 | 9.233 | 9.367 | 9.483 | 9.617 | 9.733 | 9.867 |
| Camarilla | 9.431 | 9.454 | 9.477 | 9.500 | 9.523 | 9.546 | 9.569 |
| Woodie | 9.125 | 9.238 | 9.375 | 9.488 | 9.625 | 9.738 | 9.875 |
| Fibonacci | 9.233 | 9.329 | 9.388 | 9.483 | 9.579 | 9.638 | 9.733 |
| Pivot points | S3 | S2 | S1 | PP | R1 | R2 | R3 |
|---|---|---|---|---|---|---|---|
| Standard | 8.677 | 9.013 | 9.257 | 9.593 | 9.837 | 10.173 | 10.417 |
| Camarilla | 9.341 | 9.394 | 9.447 | 9.500 | 9.553 | 9.606 | 9.660 |
| Woodie | 8.630 | 8.990 | 9.210 | 9.570 | 9.790 | 10.150 | 10.370 |
| Fibonacci | 9.013 | 9.235 | 9.372 | 9.593 | 9.815 | 9.952 | 10.173 |
| Pivot points | S3 | S2 | S1 | PP | R1 | R2 | R3 |
|---|---|---|---|---|---|---|---|
| Standard | 7.583 | 9.047 | 10.063 | 11.527 | 12.543 | 14.007 | 15.023 |
| Camarilla | 10.398 | 10.625 | 10.853 | 11.080 | 11.307 | 11.535 | 11.762 |
| Woodie | 7.360 | 8.935 | 9.840 | 11.415 | 12.320 | 13.895 | 14.800 |
| Fibonacci | 9.047 | 9.994 | 10.579 | 11.527 | 12.474 | 13.059 | 14.007 |
Numerical data
The following is the status of the technical indicators and moving averages at the time of publication of this technical analysis:
| RSI (14): | 60.60 | |
| MACD (12,26,9): | -0.0310 | |
| Directional Movement: | 4.499 | |
| AROON (14): | -21.429 | |
| DEMA (21): | 9.547 | |
| Parabolic SAR (0,02-0,02-0,2): | 9.389 | |
| Elder Ray (13): | 0.113 | |
| Super Trend (3,10): | 9.487 | |
| Zig ZAG (10): | 9.740 | |
| VORTEX (21): | 1.0330 | |
| Stochastique (14,3,5): | 96.68 | |
| TEMA (21): | 9.582 | |
| Williams %R (14): | -1.27 | |
| Chande Momentum Oscillator (20): | 0.310 | |
| Repulse (5,40,3): | 1.6380 | |
| ROCnROLL: | -1 | |
| TRIX (15,9): | -0.1110 | |
| Courbe Coppock: | 3.68 |
| MA7: | 9.747 | |
| MA20: | 10.251 | |
| MA50: | 11.374 | |
| MA100: | 13.064 | |
| MAexp7: | 9.625 | |
| MAexp20: | 9.607 | |
| MAexp50: | 9.723 | |
| MAexp100: | 9.925 | |
| Price / MA7: | -0.07% | |
| Price / MA20: | -4.98% | |
| Price / MA50: | -14.37% | |
| Price / MA100: | -25.44% | |
| Price / MAexp7: | +1.19% | |
| Price / MAexp20: | +1.38% | |
| Price / MAexp50: | +0.17% | |
| Price / MAexp100: | -1.86% |
News
The last news published on EDP RENOVAVEIS at the time of the generation of this analysis was as follows:
- EDP Renewables Announces Promotion of Gabriel Yamal to Executive Vice President
- EDP Renewables, Salt River Project, and Meta Unveil Brittlebush Solar Park in Arizona
- EDP Renewables Cuts Ribbon on Scarlet I Solar Energy Park in Fresno County, CA
- EDPR NA Distributed Generation Acquires Renewable Properties’ Community Solar Portfolio in Illinois
- EDP Renewables Introduces its Arkansas Solar Park in Mississippi County
About author
Online


Add a comment
Comments
0 comments on the analysis EDP RENOVAVEIS - 1H