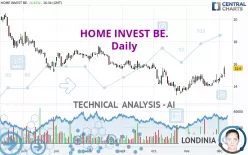
HOME INVEST BE. - Daily - Technical analysis published on 12/07/2023 (GMT)
- 137
- 0
Click here for a new analysis!
- Timeframe : Daily
- - Analysis generated on
- Status : INVALID

Summary of the analysis

Additional analysis
Quotes
The HOME INVEST BE. rating is 15.60 EUR. On the day, this instrument gained +4.42% and was traded between 14.82 EUR and 15.82 EUR over the period. The price is currently at +5.26% from its lowest and -1.39% from its highest.The Central Gaps scanner detects a bullish gap which is a sign that buyers have taken the lead in the very short term.
Opening Gap UP
Type : Bullish
Timeframe : Openning
A study of price movements over other periods shows the following variations:
New HIGH record (1 month)
Type : Bullish
Timeframe : Weekly
Technical
Technical analysis of this Daily chart of HOME INVEST BE. indicates that the overall trend is bullish. 64.29% of the signals given by moving averages are bullish. The overall trend is reinforced by the strong bullish signals from short-term moving averages. The Central Indicators scanner detects bullish signals on moving averages that could impact this trend:
Bullish price crossover with Moving Average 100
Type : Bullish
Timeframe : Daily
Bullish price crossover with adaptative moving average 100
Type : Bullish
Timeframe : Daily
An assessment of technical indicators shows a strong bullish signal.
Caution: the Central Indicators scanner currently detects an excess:
CCI indicator is overbought : over 100
Type : Neutral
Timeframe : Daily
Williams %R indicator is overbought : over -20
Type : Neutral
Timeframe : Daily
Pivot points : price is over resistance 2
Type : Neutral
Timeframe : Weekly
Pivot points : price is over resistance 3
Type : Neutral
Timeframe : Daily
Ichimoku : price is over the cloud
Type : Bullish
Timeframe : Daily
The Central Patterns scanner, which studies chart patterns, resistances and supports, has identified this signal:
Near resistance of channel
Type : Bearish
Timeframe : Daily
The Central Candlesticks scanner, specialised in Japanese candlesticks, did not identify any signals.
| S3 | S2 | S1 | Price | R1 | R2 | R3 | |
|---|---|---|---|---|---|---|---|
| ProTrendLines | 13.54 | 14.96 | 15.56 | 15.60 | 16.27 | 17.59 | 18.98 |
| Change (%) | -13.21% | -4.10% | -0.26% | - | +4.29% | +12.76% | +21.67% |
| Change | -2.06 | -0.64 | -0.04 | - | +0.67 | +1.99 | +3.38 |
| Level | Major | Major | Major | - | Minor | Intermediate | Minor |
Pivot points can also be used to set your price objectives. Here is the price situation in relation to pivot points:
| Pivot points | S3 | S2 | S1 | PP | R1 | R2 | R3 |
|---|---|---|---|---|---|---|---|
| Standard | 14.01 | 14.41 | 15.01 | 15.41 | 16.01 | 16.41 | 17.01 |
| Camarilla | 15.33 | 15.42 | 15.51 | 15.60 | 15.69 | 15.78 | 15.88 |
| Woodie | 14.10 | 14.46 | 15.10 | 15.46 | 16.10 | 16.46 | 17.10 |
| Fibonacci | 14.41 | 14.80 | 15.03 | 15.41 | 15.80 | 16.03 | 16.41 |
| Pivot points | S3 | S2 | S1 | PP | R1 | R2 | R3 |
|---|---|---|---|---|---|---|---|
| Standard | 13.41 | 13.81 | 14.27 | 14.67 | 15.13 | 15.53 | 15.99 |
| Camarilla | 14.48 | 14.56 | 14.64 | 14.72 | 14.80 | 14.88 | 14.96 |
| Woodie | 13.43 | 13.83 | 14.29 | 14.69 | 15.15 | 15.55 | 16.01 |
| Fibonacci | 13.81 | 14.14 | 14.35 | 14.67 | 15.00 | 15.21 | 15.53 |
| Pivot points | S3 | S2 | S1 | PP | R1 | R2 | R3 |
|---|---|---|---|---|---|---|---|
| Standard | 12.35 | 12.99 | 13.81 | 14.45 | 15.27 | 15.91 | 16.73 |
| Camarilla | 14.24 | 14.37 | 14.51 | 14.64 | 14.77 | 14.91 | 15.04 |
| Woodie | 12.45 | 13.04 | 13.91 | 14.50 | 15.37 | 15.96 | 16.83 |
| Fibonacci | 12.99 | 13.54 | 13.89 | 14.45 | 15.00 | 15.35 | 15.91 |
Numerical data
The following is the status of technical indicators and moving averages registered at the time this technical analysis was created:
| RSI (14): | 68.11 | |
| MACD (12,26,9): | 0.1700 | |
| Directional Movement: | 25.16 | |
| AROON (14): | 92.86 | |
| DEMA (21): | 14.74 | |
| Parabolic SAR (0,02-0,02-0,2): | 14.14 | |
| Elder Ray (13): | 0.62 | |
| Super Trend (3,10): | 13.94 | |
| Zig ZAG (10): | 15.60 | |
| VORTEX (21): | 1.0400 | |
| Stochastique (14,3,5): | 85.06 | |
| TEMA (21): | 15.02 | |
| Williams %R (14): | -12.09 | |
| Chande Momentum Oscillator (20): | 1.28 | |
| Repulse (5,40,3): | 5.7200 | |
| ROCnROLL: | 1 | |
| TRIX (15,9): | 0.0400 | |
| Courbe Coppock: | 5.43 |
| MA7: | 14.82 | |
| MA20: | 14.53 | |
| MA50: | 14.46 | |
| MA100: | 15.38 | |
| MAexp7: | 14.91 | |
| MAexp20: | 14.59 | |
| MAexp50: | 14.70 | |
| MAexp100: | 15.37 | |
| Price / MA7: | +5.26% | |
| Price / MA20: | +7.36% | |
| Price / MA50: | +7.88% | |
| Price / MA100: | +1.43% | |
| Price / MAexp7: | +4.63% | |
| Price / MAexp20: | +6.92% | |
| Price / MAexp50: | +6.12% | |
| Price / MAexp100: | +1.50% |
About author
Online


Add a comment
Comments
0 comments on the analysis HOME INVEST BE. - Daily