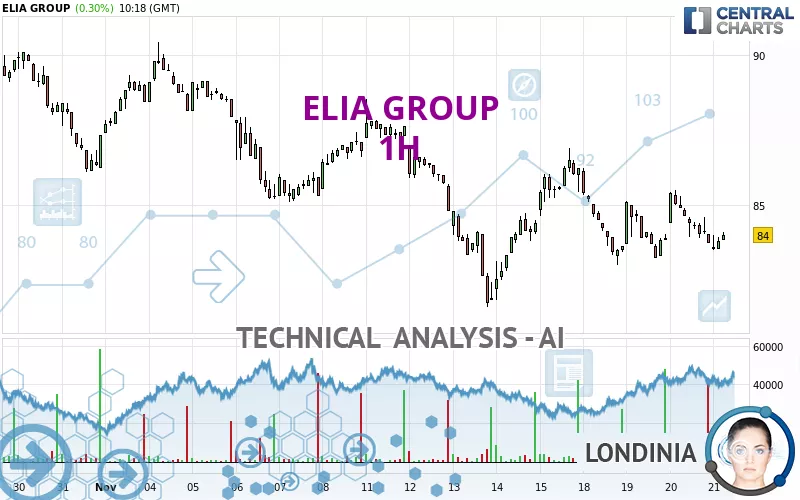
ELIA GROUP - 1H - Technical analysis published on 11/21/2024 (GMT)
- 110
- 0
Click here for a new analysis!
- Timeframe : 1H
- - Analysis generated on
- Status : INVALID
Summary of the analysis

Additional analysis
Quotes
ELIA GROUP rating 84.00 EUR. The price has increased by +0.30% since the last closing and was traded between 83.50 EUR and 84.10 EUR over the period. The price is currently at +0.60% from its lowest and -0.12% from its highest.A bearish gap was detected at the opening by the Central Gaps scanner. There are a lot of sellers and they have the upper hand in the very short term.
Opening Gap DOWN
Type : Bearish
Timeframe : Openning
So that you have an overall view of the price change, here is a table showing the variations over several periods:
Near a new LOW record (1 year)
Type : Bearish
Timeframe : Weekly
Near a new LOW record (1st january)
Type : Bearish
Timeframe : Weekly
Near a new LOW record (1 month)
Type : Bearish
Timeframe : Weekly
Technical
A technical analysis in 1H of this ELIA GROUP chart shows a sharp bearish trend. The signals given by moving averages are 85.71% bearish. This strong bearish trend is confirmed by the strong signals currently being given by short-term moving averages. The Central Indicators scanner does not detect any result on moving averages that would impact this trend.
An assessment of technical indicators does not currently provide any relevant information on the direction of future price movements.
Caution: the Central Indicators scanner currently detects an excess:
MACD indicator: bullish divergence
Type : Bullish
Timeframe : 1 hour
Price is back under the pivot point
Type : Bearish
Timeframe : Weekly
Momentum indicator is back over 0
Type : Bullish
Timeframe : 1 hour
An analysis of the price chart with the Central Patterns scanner (detector of chart patterns and resistances and supports) shows several results that can have an impact on the price change:
Near horizontal support
Type : Bullish
Timeframe : 1 hour
Support of channel is broken
Type : Bearish
Timeframe : 1 hour
Central Candlesticks, the scanner specialised in Japanese candlesticks, detects this inversion signal that could impact the current short-term trend:
Doji
Type : Neutral
Timeframe : 1 hour
| S3 | S2 | S1 | Price | R1 | R2 | R3 | |
|---|---|---|---|---|---|---|---|
| ProTrendLines | 62.72 | 81.90 | 83.25 | 84.00 | 85.13 | 87.96 | 91.45 |
| Change (%) | -25.33% | -2.50% | -0.89% | - | +1.35% | +4.71% | +8.87% |
| Change | -21.28 | -2.10 | -0.75 | - | +1.13 | +3.96 | +7.45 |
| Level | Minor | Major | Intermediate | - | Major | Intermediate | Intermediate |
To determine price objectives, it is also possible to use the pivot points. Here is the price position in relation to pivot points:
| Pivot points | S3 | S2 | S1 | PP | R1 | R2 | R3 |
|---|---|---|---|---|---|---|---|
| Standard | 81.42 | 82.58 | 83.17 | 84.33 | 84.92 | 86.08 | 86.67 |
| Camarilla | 83.27 | 83.43 | 83.59 | 83.75 | 83.91 | 84.07 | 84.23 |
| Woodie | 81.13 | 82.44 | 82.88 | 84.19 | 84.63 | 85.94 | 86.38 |
| Fibonacci | 82.58 | 83.25 | 83.67 | 84.33 | 85.00 | 85.42 | 86.08 |
| Pivot points | S3 | S2 | S1 | PP | R1 | R2 | R3 |
|---|---|---|---|---|---|---|---|
| Standard | 75.43 | 78.52 | 82.38 | 85.47 | 89.33 | 92.42 | 96.28 |
| Camarilla | 84.34 | 84.98 | 85.61 | 86.25 | 86.89 | 87.52 | 88.16 |
| Woodie | 75.83 | 78.71 | 82.78 | 85.66 | 89.73 | 92.61 | 96.68 |
| Fibonacci | 78.52 | 81.17 | 82.81 | 85.47 | 88.12 | 89.76 | 92.42 |
| Pivot points | S3 | S2 | S1 | PP | R1 | R2 | R3 |
|---|---|---|---|---|---|---|---|
| Standard | 63.20 | 74.65 | 81.00 | 92.45 | 98.80 | 110.25 | 116.60 |
| Camarilla | 82.46 | 84.09 | 85.72 | 87.35 | 88.98 | 90.61 | 92.25 |
| Woodie | 60.65 | 73.38 | 78.45 | 91.18 | 96.25 | 108.98 | 114.05 |
| Fibonacci | 74.65 | 81.45 | 85.65 | 92.45 | 99.25 | 103.45 | 110.25 |
Numerical data
The following is the status of technical indicators and moving averages registered at the time this technical analysis was created:
| RSI (14): | 46.32 | |
| MACD (12,26,9): | -0.1900 | |
| Directional Movement: | -8.58 | |
| AROON (14): | 28.57 | |
| DEMA (21): | 83.96 | |
| Parabolic SAR (0,02-0,02-0,2): | 85.15 | |
| Elder Ray (13): | -0.19 | |
| Super Trend (3,10): | 83.34 | |
| Zig ZAG (10): | 84.05 | |
| VORTEX (21): | 0.9700 | |
| Stochastique (14,3,5): | 23.96 | |
| TEMA (21): | 83.94 | |
| Williams %R (14): | -65.91 | |
| Chande Momentum Oscillator (20): | 0.15 | |
| Repulse (5,40,3): | 0.0800 | |
| ROCnROLL: | 2 | |
| TRIX (15,9): | -0.0200 | |
| Courbe Coppock: | 0.20 |
| MA7: | 83.99 | |
| MA20: | 86.65 | |
| MA50: | 94.01 | |
| MA100: | 95.04 | |
| MAexp7: | 83.99 | |
| MAexp20: | 84.19 | |
| MAexp50: | 84.58 | |
| MAexp100: | 85.56 | |
| Price / MA7: | +0.01% | |
| Price / MA20: | -3.06% | |
| Price / MA50: | -10.65% | |
| Price / MA100: | -11.62% | |
| Price / MAexp7: | +0.01% | |
| Price / MAexp20: | -0.23% | |
| Price / MAexp50: | -0.69% | |
| Price / MAexp100: | -1.82% |
News
The last news published on ELIA GROUP at the time of the generation of this analysis was as follows:
About author
Online


Add a comment
Comments
0 comments on the analysis ELIA GROUP - 1H