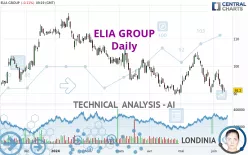
ELIA GROUP - Daily - Technical analysis published on 06/12/2024 (GMT)
- 126
- 0
Click here for a new analysis!
- Timeframe : Daily
- - Analysis generated on
- Status : TARGET REACHED

Summary of the analysis

Additional analysis
Quotes
ELIA GROUP rating 91.20 EUR. On the day, this instrument lost -0.11% and was traded between 90.60 EUR and 92.15 EUR over the period. The price is currently at +0.66% from its lowest and -1.03% from its highest.A bullish opening was detected by the Central Gaps scanner. Buyers are trying to impose a bullish momentum in the very short term.
Bullish opening
Type : Bullish
Timeframe : Openning
Here is a more detailed summary of the historical variations registered by ELIA GROUP:
Near a new LOW record (1st january)
Type : Bearish
Timeframe : Weekly
Near a new LOW record (1 month)
Type : Bearish
Timeframe : Weekly
Technical
A technical analysis in Daily of this ELIA GROUP chart shows a sharp bearish trend. 89.29% of the signals given by moving averages are bearish. This strongly bearish trend is supported by the strong bearish signals given by short-term moving averages. There is no crossing of moving average by the price or crossing of moving averages between themselves.
In fact, 11 technical indicators on 18 studied are currently bearish. Caution: the Central Indicators scanner currently detects an excess:
CCI indicator is oversold : under -100
Type : Neutral
Timeframe : Daily
RSI indicator: bullish divergence
Type : Bullish
Timeframe : Daily
Williams %R indicator is oversold : under -80
Type : Neutral
Timeframe : Daily
The Central Patterns scanner, which studies chart patterns, resistances and supports, has identified this signal:
Near support of channel
Type : Bullish
Timeframe : Daily
The Central Candlesticks scanner which studies Japanese candlesticks did not detect anything.
| S3 | S2 | S1 | Price | R1 | R2 | R3 | |
|---|---|---|---|---|---|---|---|
| ProTrendLines | 85.13 | 87.96 | 90.84 | 91.20 | 93.25 | 102.29 | 109.27 |
| Change (%) | -6.66% | -3.55% | -0.39% | - | +2.25% | +12.16% | +19.81% |
| Change | -6.07 | -3.24 | -0.36 | - | +2.05 | +11.09 | +18.07 |
| Level | Major | Intermediate | Intermediate | - | Minor | Major | Minor |
Attention could also be paid to pivot points to set price objectives:
| Pivot points | S3 | S2 | S1 | PP | R1 | R2 | R3 |
|---|---|---|---|---|---|---|---|
| Standard | 86.63 | 88.47 | 89.88 | 91.72 | 93.13 | 94.97 | 96.38 |
| Camarilla | 90.41 | 90.70 | 91.00 | 91.30 | 91.60 | 91.90 | 92.19 |
| Woodie | 86.43 | 88.36 | 89.68 | 91.61 | 92.93 | 94.86 | 96.18 |
| Fibonacci | 88.47 | 89.71 | 90.48 | 91.72 | 92.96 | 93.73 | 94.97 |
| Pivot points | S3 | S2 | S1 | PP | R1 | R2 | R3 |
|---|---|---|---|---|---|---|---|
| Standard | 84.67 | 88.53 | 91.02 | 94.88 | 97.37 | 101.23 | 103.72 |
| Camarilla | 91.75 | 92.34 | 92.92 | 93.50 | 94.08 | 94.66 | 95.25 |
| Woodie | 83.98 | 88.19 | 90.33 | 94.54 | 96.68 | 100.89 | 103.03 |
| Fibonacci | 88.53 | 90.96 | 92.46 | 94.88 | 97.31 | 98.81 | 101.23 |
| Pivot points | S3 | S2 | S1 | PP | R1 | R2 | R3 |
|---|---|---|---|---|---|---|---|
| Standard | 72.36 | 80.38 | 86.89 | 94.91 | 101.42 | 109.44 | 115.95 |
| Camarilla | 89.40 | 90.74 | 92.07 | 93.40 | 94.73 | 96.06 | 97.40 |
| Woodie | 71.61 | 80.00 | 86.14 | 94.53 | 100.67 | 109.06 | 115.20 |
| Fibonacci | 80.38 | 85.93 | 89.36 | 94.91 | 100.46 | 103.89 | 109.44 |
Numerical data
The following is the status of the technical indicators and moving averages at the time of publication of this technical analysis:
| RSI (14): | 41.17 | |
| MACD (12,26,9): | -0.6500 | |
| Directional Movement: | -10.91 | |
| AROON (14): | -21.43 | |
| DEMA (21): | 93.68 | |
| Parabolic SAR (0,02-0,02-0,2): | 98.28 | |
| Elder Ray (13): | -2.50 | |
| Super Trend (3,10): | 98.89 | |
| Zig ZAG (10): | 91.20 | |
| VORTEX (21): | 0.8400 | |
| Stochastique (14,3,5): | 18.00 | |
| TEMA (21): | 93.01 | |
| Williams %R (14): | -89.35 | |
| Chande Momentum Oscillator (20): | -3.81 | |
| Repulse (5,40,3): | -2.3100 | |
| ROCnROLL: | 2 | |
| TRIX (15,9): | -0.0100 | |
| Courbe Coppock: | 7.96 |
| MA7: | 94.11 | |
| MA20: | 95.31 | |
| MA50: | 93.84 | |
| MA100: | 97.57 | |
| MAexp7: | 93.07 | |
| MAexp20: | 94.28 | |
| MAexp50: | 95.08 | |
| MAexp100: | 96.84 | |
| Price / MA7: | -3.09% | |
| Price / MA20: | -4.31% | |
| Price / MA50: | -2.81% | |
| Price / MA100: | -6.53% | |
| Price / MAexp7: | -2.01% | |
| Price / MAexp20: | -3.27% | |
| Price / MAexp50: | -4.08% | |
| Price / MAexp100: | -5.82% |
News
The last news published on ELIA GROUP at the time of the generation of this analysis was as follows:
About author
Online


Add a comment
Comments
0 comments on the analysis ELIA GROUP - Daily