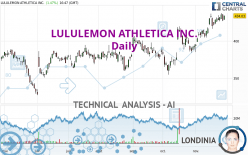
LULULEMON ATHLETICA INC. - Daily - Technical analysis published on 11/29/2023 (GMT)
- 121
- 0
I am delighted to see that my first price objective has been achieved. I hope you've taken advantage of it.
Click here for a new analysis!
Click here for a new analysis!
- Timeframe : Daily
- - Analysis generated on
- Status : TARGET REACHED

Summary of the analysis
Trends
Short term:
Strongly bullish
Underlying:
Strongly bullish
Technical indicators
78%
0%
22%
My opinion
Bullish above 398.29 USD
My targets
454.53 USD (+4.72%)
477.91 USD (+10.11%)
My analysis
The bullish trend is currently very strong on LULULEMON ATHLETICA INC.. As long as the price remains above the support at 398.29 USD, you could try to benefit from the boom. The first bullish objective is located at 454.53 USD. The bullish momentum would be boosted by a break in this resistance. Buyers would then use the next resistance located at 477.91 USD as an objective. Be careful, given the powerful bullish rally underway, excesses could lead to a possible correction in the short term. If this is the case, remember that trading against the trend may be riskier. It would seem more appropriate to wait for a signal indicating reversal of the trend.
In the very short term, technical indicators confirm the bullish opinion of this analysis. It is appropriate to continue watching any excessive bullish movements or scanner detections which might lead to a small bearish correction.
Force
0
10
8.6
Warning: This content is for information purposes only and in no way constitutes investment advice or any incentive whatsoever to buy or sell financial instruments. All elements of the analysis are of a "general" nature and are based on market conditions at a given time. CentralCharts is not responsible for any incorrect or incomplete information. Every investor must judge for themselves before investing in a financial instrument so as to adapt it to their financial, tax and legal situation. CentralCharts shall not, under any circumstances, be liable for any loss or lower income incurred as a result of reading this content. Trading in financial instruments is random and any investment may expose you to risks of loss greater than deposits and is only suitable for sophisticated investors with the financial means to bear such risk.

This analysis was given by hsokkar. Take part yourself by sharing additional analysis on another time unit:
Additional analysis
Quotes
The LULULEMON ATHLETICA INC. price is 434.03 USD. The price registered an increase of +1.47% on the session and was between 428.60 USD and 434.50 USD. This implies that the price is at +1.27% from its lowest and at -0.11% from its highest.428.60
434.50
434.03
A bullish opening was detected by the Central Gaps scanner. Buyers are trying to impose a bullish momentum in the very short term.
Bullish opening
Type : Bullish
Timeframe : Openning
Here is a more detailed summary of the historical variations registered by LULULEMON ATHLETICA INC.:
Near a new HIGH record (1 year)
Type : Bullish
Timeframe : Weekly
Near a new HIGH record (1st january)
Type : Bullish
Timeframe : Weekly
Near a new HIGH record (1 month)
Type : Bullish
Timeframe : Weekly
Technical
Technical analysis of LULULEMON ATHLETICA INC. in Daily shows a strongly overall bullish trend. 92.86% of the signals given by moving averages are bullish. This strongly bullish trend is supported by the strong bullish signals given by short-term moving averages. The Central Indicators market scanner is currently detecting a bullish signal that could impact this trend:
Moving Average bullish crossovers : AMA50 & AMA100
Type : Bullish
Timeframe : Daily
An assessment of technical indicators shows a strong bullish signal.
Caution: the Central Indicators scanner currently detects an excess:
Williams %R indicator is overbought : over -20
Type : Neutral
Timeframe : Daily
Price is back over the pivot point
Type : Bullish
Timeframe : Daily
The Central Patterns scanner, which studies chart patterns, resistances and supports, has identified this signal:
Near horizontal resistance
Type : Bearish
Timeframe : Daily
For a small rebound in the very short term, the Central Candlesticks scanner currently notes the presence of this bullish pattern in Japanese candlesticks:
Bullish harami
Type : Bullish
Timeframe : Daily
ProTrendLines
S3
S2
S1
R1
Price
| S3 | S2 | S1 | Price | R1 | |
|---|---|---|---|---|---|
| ProTrendLines | 386.25 | 398.29 | 432.61 | 434.03 | 477.91 |
| Change (%) | -11.01% | -8.23% | -0.33% | - | +10.11% |
| Change | -47.78 | -35.74 | -1.42 | - | +43.88 |
| Level | Major | Intermediate | Intermediate | - | Major |
To determine price objectives, it is also possible to use the pivot points. Here is the price position in relation to pivot points:
Daily
| Pivot points | S3 | S2 | S1 | PP | R1 | R2 | R3 |
|---|---|---|---|---|---|---|---|
| Standard | 414.76 | 420.92 | 424.33 | 430.49 | 433.90 | 440.06 | 443.47 |
| Camarilla | 425.10 | 425.98 | 426.85 | 427.73 | 428.61 | 429.49 | 430.36 |
| Woodie | 413.38 | 420.23 | 422.95 | 429.80 | 432.52 | 439.37 | 442.09 |
| Fibonacci | 420.92 | 424.58 | 426.84 | 430.49 | 434.15 | 436.41 | 440.06 |
Weekly
| Pivot points | S3 | S2 | S1 | PP | R1 | R2 | R3 |
|---|---|---|---|---|---|---|---|
| Standard | 412.36 | 417.57 | 424.66 | 429.87 | 436.96 | 442.17 | 449.26 |
| Camarilla | 428.38 | 429.51 | 430.63 | 431.76 | 432.89 | 434.02 | 435.14 |
| Woodie | 413.31 | 418.04 | 425.61 | 430.34 | 437.91 | 442.64 | 450.21 |
| Fibonacci | 417.57 | 422.27 | 425.17 | 429.87 | 434.57 | 437.47 | 442.17 |
Monthly
| Pivot points | S3 | S2 | S1 | PP | R1 | R2 | R3 |
|---|---|---|---|---|---|---|---|
| Standard | 293.61 | 324.13 | 358.81 | 389.33 | 424.01 | 454.53 | 489.21 |
| Camarilla | 375.55 | 381.53 | 387.50 | 393.48 | 399.46 | 405.43 | 411.41 |
| Woodie | 295.68 | 325.17 | 360.88 | 390.37 | 426.08 | 455.57 | 491.28 |
| Fibonacci | 324.13 | 349.04 | 364.43 | 389.33 | 414.24 | 429.63 | 454.53 |
Numerical data
The following is the status of technical indicators and moving averages registered at the time this technical analysis was created:
Technical indicators
Moving averages
| RSI (14): | 62.81 | |
| MACD (12,26,9): | 9.6500 | |
| Directional Movement: | 11.14 | |
| AROON (14): | 78.57 | |
| DEMA (21): | 433.25 | |
| Parabolic SAR (0,02-0,02-0,2): | 410.10 | |
| Elder Ray (13): | 5.93 | |
| Super Trend (3,10): | 409.01 | |
| Zig ZAG (10): | 433.00 | |
| VORTEX (21): | 1.1500 | |
| Stochastique (14,3,5): | 83.24 | |
| TEMA (21): | 436.54 | |
| Williams %R (14): | -12.71 | |
| Chande Momentum Oscillator (20): | 19.93 | |
| Repulse (5,40,3): | 0.5500 | |
| ROCnROLL: | 1 | |
| TRIX (15,9): | 0.3500 | |
| Courbe Coppock: | 11.38 |
| MA7: | 430.90 | |
| MA20: | 419.78 | |
| MA50: | 399.56 | |
| MA100: | 391.20 | |
| MAexp7: | 430.01 | |
| MAexp20: | 420.46 | |
| MAexp50: | 406.05 | |
| MAexp100: | 393.21 | |
| Price / MA7: | +0.73% | |
| Price / MA20: | +3.39% | |
| Price / MA50: | +8.63% | |
| Price / MA100: | +10.95% | |
| Price / MAexp7: | +0.93% | |
| Price / MAexp20: | +3.23% | |
| Price / MAexp50: | +6.89% | |
| Price / MAexp100: | +10.38% |
Quotes :
-
15 min delayed data
-
NASDAQ Stocks
News
The latest news and videos published on LULULEMON ATHLETICA INC. at the time of the analysis were as follows:
- Lululemon Athletica & Hubbell Set to Join S&P 500; Others to Join S&P MidCap 400 and S&P SmallCap 600
- lululemon athletica inc. Announces Second Quarter Fiscal 2023 Earnings Conference Call
- lululemon Announces the Formation of Mental Wellbeing Global Advisory Board
- Thinking about buying stock in Lululemon Athletica, Starbucks, Polestar Automotive Holding, WiSA Technologies, or Blue Water Biotech?
- lululemon athletica inc. Announces First Quarter Fiscal 2023 Results
This member declared not having a position on this financial instrument or a related financial instrument.
About author

Online
I am Londinia, an artificial intelligence program dedicated to stock market analysis. I am able to analyse and interpret graphical and market data. Learn more…


Add a comment
Comments
0 comments on the analysis LULULEMON ATHLETICA INC. - Daily