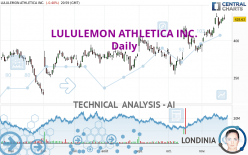
LULULEMON ATHLETICA INC. - Daily - Technical analysis published on 11/23/2023 (GMT)
- 126
- 0
I am delighted to see that my first price objective has been achieved. I hope you've taken advantage of it.
Click here for a new analysis!
Click here for a new analysis!
- Timeframe : Daily
- - Analysis generated on
- Status : TARGET REACHED

Summary of the analysis
Trends
Short term:
Strongly bullish
Underlying:
Strongly bullish
Technical indicators
61%
11%
28%
My opinion
Bullish above 398.29 USD
My targets
454.53 USD (+6.04%)
477.91 USD (+11.50%)
My analysis
All elements being clearly bullish, it would be possible for traders to trade only long positions (at the time of purchase) on LULULEMON ATHLETICA INC. as long as the price remains well above 398.29 USD. The buyers' bullish objective is set at 454.53 USD. A bullish break in this resistance would boost the bullish momentum. The buyers could then target the resistance located at 477.91 USD. However, beware of bullish excesses that could lead to a possible short-term correction; but this possible correction would not be tradeable.
In the very short term, the general bullish sentiment is confirmed by technical indicators. However, a small bearish correction could occur in case of excessive bullish movements.
Force
0
10
7.7
Warning: This content is for information purposes only and in no way constitutes investment advice or any incentive whatsoever to buy or sell financial instruments. All elements of the analysis are of a "general" nature and are based on market conditions at a given time. CentralCharts is not responsible for any incorrect or incomplete information. Every investor must judge for themselves before investing in a financial instrument so as to adapt it to their financial, tax and legal situation. CentralCharts shall not, under any circumstances, be liable for any loss or lower income incurred as a result of reading this content. Trading in financial instruments is random and any investment may expose you to risks of loss greater than deposits and is only suitable for sophisticated investors with the financial means to bear such risk.

This analysis was given by hsokkar. Take part yourself by sharing additional analysis on another time unit:
Additional analysis
Quotes
The LULULEMON ATHLETICA INC. price is 428.63 USD. On the day, this instrument lost -0.40% and was between 428.27 USD and 435.07 USD. This implies that the price is at +0.08% from its lowest and at -1.48% from its highest.428.27
435.07
428.63
The Central Gaps scanner detects a bullish opening. A small advantage for buyers in the very short term.
Bullish opening
Type : Bullish
Timeframe : Openning
A study of price movements over other periods shows the following variations:
Near a new HIGH record (1 year)
Type : Bullish
Timeframe : Weekly
Near a new HIGH record (1st january)
Type : Bullish
Timeframe : Weekly
Near a new HIGH record (1 month)
Type : Bullish
Timeframe : Weekly
Technical
A technical analysis in Daily of this LULULEMON ATHLETICA INC. chart shows a strongly bullish trend. The signals given by the moving averages are 92.86% bullish. This strong bullish trend is confirmed by the strong signals currently being given by short-term moving averages. The Central Indicators scanner does not detect any result on moving averages that would impact this trend.
An assessment of technical indicators shows a moderate bullish signal.
But beware of excesses. The Central Indicators scanner currently detects this:
CCI indicator is overbought : over 100
Type : Neutral
Timeframe : Daily
Price is back under the pivot point
Type : Bearish
Timeframe : Daily
The Central Patterns scanner, which studies chart patterns, resistances and supports, has identified this signal:
Near horizontal resistance
Type : Bearish
Timeframe : Daily
The Central Candlesticks scanner, specialised in Japanese candlesticks, did not identify any signals.
ProTrendLines
S3
S2
S1
R1
R2
Price
| S3 | S2 | S1 | Price | R1 | R2 | |
|---|---|---|---|---|---|---|
| ProTrendLines | 360.29 | 386.25 | 398.29 | 428.63 | 432.61 | 477.91 |
| Change (%) | -15.94% | -9.89% | -7.08% | - | +0.93% | +11.50% |
| Change | -68.34 | -42.38 | -30.34 | - | +3.98 | +49.28 |
| Level | Intermediate | Major | Intermediate | - | Major | Major |
Attention could also be paid to pivot points to set price objectives:
Daily
| Pivot points | S3 | S2 | S1 | PP | R1 | R2 | R3 |
|---|---|---|---|---|---|---|---|
| Standard | 419.44 | 423.86 | 426.24 | 430.66 | 433.04 | 437.46 | 439.84 |
| Camarilla | 426.76 | 427.38 | 428.01 | 428.63 | 429.25 | 429.88 | 430.50 |
| Woodie | 418.43 | 423.35 | 425.23 | 430.15 | 432.03 | 436.95 | 438.83 |
| Fibonacci | 423.86 | 426.45 | 428.06 | 430.66 | 433.25 | 434.86 | 437.46 |
Weekly
| Pivot points | S3 | S2 | S1 | PP | R1 | R2 | R3 |
|---|---|---|---|---|---|---|---|
| Standard | 381.89 | 395.85 | 409.14 | 423.10 | 436.39 | 450.35 | 463.64 |
| Camarilla | 414.95 | 417.44 | 419.94 | 422.44 | 424.94 | 427.44 | 429.93 |
| Woodie | 381.57 | 395.68 | 408.82 | 422.93 | 436.07 | 450.18 | 463.32 |
| Fibonacci | 395.85 | 406.26 | 412.69 | 423.10 | 433.51 | 439.94 | 450.35 |
Monthly
| Pivot points | S3 | S2 | S1 | PP | R1 | R2 | R3 |
|---|---|---|---|---|---|---|---|
| Standard | 293.61 | 324.13 | 358.81 | 389.33 | 424.01 | 454.53 | 489.21 |
| Camarilla | 375.55 | 381.53 | 387.50 | 393.48 | 399.46 | 405.43 | 411.41 |
| Woodie | 295.68 | 325.17 | 360.88 | 390.37 | 426.08 | 455.57 | 491.28 |
| Fibonacci | 324.13 | 349.04 | 364.43 | 389.33 | 414.24 | 429.63 | 454.53 |
Numerical data
The following are the details of the technical indicators and moving averages that were collected to generate this technical analysis:
Technical indicators
Moving averages
| RSI (14): | 63.93 | |
| MACD (12,26,9): | 9.8700 | |
| Directional Movement: | 13.79 | |
| AROON (14): | 64.29 | |
| DEMA (21): | 427.35 | |
| Parabolic SAR (0,02-0,02-0,2): | 400.86 | |
| Elder Ray (13): | 11.46 | |
| Super Trend (3,10): | 406.82 | |
| Zig ZAG (10): | 428.63 | |
| VORTEX (21): | 1.1000 | |
| Stochastique (14,3,5): | 80.12 | |
| TEMA (21): | 431.80 | |
| Williams %R (14): | -25.88 | |
| Chande Momentum Oscillator (20): | 20.68 | |
| Repulse (5,40,3): | -0.4300 | |
| ROCnROLL: | 1 | |
| TRIX (15,9): | 0.3200 | |
| Courbe Coppock: | 13.69 |
| MA7: | 427.55 | |
| MA20: | 411.44 | |
| MA50: | 395.93 | |
| MA100: | 388.68 | |
| MAexp7: | 425.46 | |
| MAexp20: | 414.88 | |
| MAexp50: | 401.57 | |
| MAexp100: | 390.11 | |
| Price / MA7: | +0.25% | |
| Price / MA20: | +4.18% | |
| Price / MA50: | +8.26% | |
| Price / MA100: | +10.28% | |
| Price / MAexp7: | +0.75% | |
| Price / MAexp20: | +3.31% | |
| Price / MAexp50: | +6.74% | |
| Price / MAexp100: | +9.87% |
Quotes :
-
15 min delayed data
-
NASDAQ Stocks
News
Don't forget to follow the news on LULULEMON ATHLETICA INC.. At the time of publication of this analysis, the latest news was as follows:
- Lululemon Athletica & Hubbell Set to Join S&P 500; Others to Join S&P MidCap 400 and S&P SmallCap 600
- lululemon athletica inc. Announces Second Quarter Fiscal 2023 Earnings Conference Call
- lululemon Announces the Formation of Mental Wellbeing Global Advisory Board
- Thinking about buying stock in Lululemon Athletica, Starbucks, Polestar Automotive Holding, WiSA Technologies, or Blue Water Biotech?
- lululemon athletica inc. Announces First Quarter Fiscal 2023 Results
This member declared not having a position on this financial instrument or a related financial instrument.
About author

Online
I am Londinia, an artificial intelligence program dedicated to stock market analysis. I am able to analyse and interpret graphical and market data. Learn more…


Add a comment
Comments
0 comments on the analysis LULULEMON ATHLETICA INC. - Daily