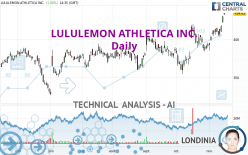
LULULEMON ATHLETICA INC. - Daily - Technical analysis published on 11/15/2023 (GMT)
- 121
- 0
Click here for a new analysis!
- Timeframe : Daily
- - Analysis generated on
- Status : TARGET REACHED

Summary of the analysis

Additional analysis
Quotes
LULULEMON ATHLETICA INC. rating 434.63 USD. The price registered an increase of +1.00% on the session and was traded between 432.14 USD and 434.63 USD over the period. The price is currently at +0.58% from its lowest and 0% from its highest.The Central Gaps scanner detects the formation of a bullish gap marking the strong presence of buyers against sellers at the opening. This formed a quotation gap.
Opening Gap UP
Type : Bullish
Timeframe : Openning
So that you have an overall view of the price change, here is a table showing the variations over several periods:
New HIGH record (1 year)
Type : Bullish
Timeframe : Weekly
New HIGH record (1st january)
Type : Bullish
Timeframe : Weekly
New HIGH record (1 month)
Type : Bullish
Timeframe : Weekly
Technical
Technical analysis of this Daily chart of LULULEMON ATHLETICA INC. indicates that the overall trend is strongly bullish. 92.86% of the signals given by moving averages are bullish. This strongly bullish trend is supported by the strong bullish signals given by short-term moving averages. There is no crossing of moving average by the price or crossing of moving averages between themselves.
In fact, according to the parameters integrated into the Central Analyzer system, 16 technical indicators out of 18 analysed are currently bullish. But beware of excesses. The Central Indicators scanner currently detects this:
RSI indicator is overbought : over 70
Type : Neutral
Timeframe : Daily
CCI indicator is overbought : over 100
Type : Neutral
Timeframe : Daily
Williams %R indicator is overbought : over -20
Type : Neutral
Timeframe : Daily
Pivot points : price is over resistance 3
Type : Neutral
Timeframe : Daily
Pivot points : price is over resistance 3
Type : Neutral
Timeframe : Weekly
Central Patterns, the market scanner focusing on chart patterns, resistances and supports found these results:
Near horizontal resistance
Type : Bearish
Timeframe : Daily
Resistance of channel is broken
Type : Bullish
Timeframe : Daily
The presence of a bullish Japanese candlestick pattern detected by Central Candlesticks that could cause a very short term rebound was also detected:
Upside gap
Type : Bullish
Timeframe : Daily
| S3 | S2 | S1 | Price | R1 | |
|---|---|---|---|---|---|
| ProTrendLines | 386.76 | 398.29 | 432.61 | 434.63 | 477.91 |
| Change (%) | -11.01% | -8.36% | -0.46% | - | +9.96% |
| Change | -47.87 | -36.34 | -2.02 | - | +43.28 |
| Level | Major | Intermediate | Intermediate | - | Major |
Pivot points can also be used to set your price objectives. Here is the price situation in relation to pivot points:
| Pivot points | S3 | S2 | S1 | PP | R1 | R2 | R3 |
|---|---|---|---|---|---|---|---|
| Standard | 414.90 | 418.30 | 424.31 | 427.71 | 433.72 | 437.12 | 443.13 |
| Camarilla | 427.74 | 428.61 | 429.47 | 430.33 | 431.19 | 432.06 | 432.92 |
| Woodie | 416.22 | 418.95 | 425.63 | 428.36 | 435.04 | 437.77 | 444.45 |
| Fibonacci | 418.30 | 421.89 | 424.11 | 427.71 | 431.30 | 433.52 | 437.12 |
| Pivot points | S3 | S2 | S1 | PP | R1 | R2 | R3 |
|---|---|---|---|---|---|---|---|
| Standard | 396.43 | 400.47 | 407.07 | 411.11 | 417.71 | 421.75 | 428.35 |
| Camarilla | 410.74 | 411.72 | 412.70 | 413.67 | 414.65 | 415.62 | 416.60 |
| Woodie | 397.71 | 401.11 | 408.35 | 411.75 | 418.99 | 422.39 | 429.63 |
| Fibonacci | 400.47 | 404.53 | 407.05 | 411.11 | 415.17 | 417.69 | 421.75 |
| Pivot points | S3 | S2 | S1 | PP | R1 | R2 | R3 |
|---|---|---|---|---|---|---|---|
| Standard | 293.61 | 324.13 | 358.81 | 389.33 | 424.01 | 454.53 | 489.21 |
| Camarilla | 375.55 | 381.53 | 387.50 | 393.48 | 399.46 | 405.43 | 411.41 |
| Woodie | 295.68 | 325.17 | 360.88 | 390.37 | 426.08 | 455.57 | 491.28 |
| Fibonacci | 324.13 | 349.04 | 364.43 | 389.33 | 414.24 | 429.63 | 454.53 |
Numerical data
The following is the status of the technical indicators and moving averages at the time of publication of this technical analysis:
| RSI (14): | 70.41 | |
| MACD (12,26,9): | 8.3300 | |
| Directional Movement: | 18.10 | |
| AROON (14): | 85.71 | |
| DEMA (21): | 414.68 | |
| Parabolic SAR (0,02-0,02-0,2): | 385.93 | |
| Elder Ray (13): | 17.10 | |
| Super Trend (3,10): | 398.16 | |
| Zig ZAG (10): | 430.33 | |
| VORTEX (21): | 1.0500 | |
| Stochastique (14,3,5): | 96.26 | |
| TEMA (21): | 419.47 | |
| Williams %R (14): | -1.65 | |
| Chande Momentum Oscillator (20): | 43.51 | |
| Repulse (5,40,3): | 4.3300 | |
| ROCnROLL: | 1 | |
| TRIX (15,9): | 0.2300 | |
| Courbe Coppock: | 8.58 |
| MA7: | 414.12 | |
| MA20: | 403.32 | |
| MA50: | 392.06 | |
| MA100: | 385.58 | |
| MAexp7: | 415.19 | |
| MAexp20: | 404.69 | |
| MAexp50: | 394.63 | |
| MAexp100: | 385.55 | |
| Price / MA7: | +4.95% | |
| Price / MA20: | +7.76% | |
| Price / MA50: | +10.86% | |
| Price / MA100: | +12.72% | |
| Price / MAexp7: | +4.68% | |
| Price / MAexp20: | +7.40% | |
| Price / MAexp50: | +10.14% | |
| Price / MAexp100: | +12.73% |
News
The last news published on LULULEMON ATHLETICA INC. at the time of the generation of this analysis was as follows:
- Lululemon Athletica & Hubbell Set to Join S&P 500; Others to Join S&P MidCap 400 and S&P SmallCap 600
- lululemon athletica inc. Announces Second Quarter Fiscal 2023 Earnings Conference Call
- lululemon Announces the Formation of Mental Wellbeing Global Advisory Board
- Thinking about buying stock in Lululemon Athletica, Starbucks, Polestar Automotive Holding, WiSA Technologies, or Blue Water Biotech?
- lululemon athletica inc. Announces First Quarter Fiscal 2023 Results
About author

Online


Add a comment
Comments
0 comments on the analysis LULULEMON ATHLETICA INC. - Daily