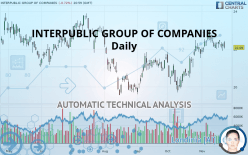
INTERPUBLIC GROUP OF COMPANIES - Daily - Technical analysis published on 11/25/2019 (GMT)
- Who voted?
- 250
- 0
I am delighted to see that my first price objective has been achieved. I hope you've taken advantage of it.
Click here for a new analysis!
Click here for a new analysis!
- Timeframe : Daily
- - Analysis generated on
- Status : TARGET REACHED

Summary of the analysis
Trends
Court terme:
Neutral
De fond:
Bullish
Technical indicators
22%
33%
44%
My opinion
Bullish above 21.83 USD
My targets
22.15 USD (+0.27%)
22.51 USD (+1.90%)
My analysis
We are currently in a phase of short-term indecision. In a case like this, you could favour trades in the direction of the basic trend on INTERPUBLIC GROUP OF COMPANIES. As long as you are above the support located at 21.83 USD, traders with an aggressive trading strategy could consider a purchase. A cross of the resistance located at 22.15 USD would be a signal that the basic trade will reverse and the short-term trend could then quickly become bullish. Buyers would then use the next resistance located at 22.51 USD as an objective. Crossing it would then enable buyers to target 22.97 USD. If the support 21.83 USD were to be broken, this would simply be a sign of a possible continuation of short-term consolidation and trading against the trend would then perhaps be more risky.
Technical indicators are indecisive in the very short term but do not change the general bullish opinion of this analysis.
FORCE
0
10
1.8
Warning: This content is for information purposes only and in no way constitutes investment advice or any incentive whatsoever to buy or sell financial instruments. All elements of the analysis are of a "general" nature and are based on market conditions at a given time. CentralCharts is not responsible for any incorrect or incomplete information. Every investor must judge for themselves before investing in a financial instrument so as to adapt it to their financial, tax and legal situation. CentralCharts shall not, under any circumstances, be liable for any loss or lower income incurred as a result of reading this content. Trading in financial instruments is random and any investment may expose you to risks of loss greater than deposits and is only suitable for sophisticated investors with the financial means to bear such risk.

This analysis was given by Vincent Launay. Take part yourself by sharing additional analysis on another time unit:
Additional analysis
Quotes
INTERPUBLIC GROUP OF COMPANIES rating 22.09 USD. The price registered a decrease of -0.72% on the session and was between 22.02 USD and 22.42 USD. This implies that the price is at +0.32% from its lowest and at -1.47% from its highest.22.02
22.42
22.09
A bullish gap was detected at the opening by the Central Gaps scanner. There are a lot of buyers and they have the upper hand in the very short term.
Opening Gap UP
Type : Bullish
Timeframe : Openning
Here is a more detailed summary of the historical variations registered by INTERPUBLIC GROUP OF COMPANIES:
Technical
Technical analysis of INTERPUBLIC GROUP OF COMPANIES in Daily shows an overall bullish trend. 64.29% of the signals given by moving averages are bullish. Caution: the neutral signals currently given by short-term moving averages show us that the global trend is losing momentum. The Central Indicators market scanner is currently detecting a bullish signal that could impact this trend:
Moving Average bullish crossovers : MA50 & MA100
Type : Bullish
Timeframe : Daily
In fact, Central Analyzer took into account 18 technical indicators and the result was as follows: 4 are bullish, 8 are neutral and 6 are bearish. Central Indicators, the scanner specialised in technical indicators, has identified these signals:
Price is back under the pivot point
Type : Bearish
Timeframe : Weekly
Momentum indicator is back under 0
Type : Bearish
Timeframe : Daily
An analysis of the price chart with the Central Patterns scanner (detector of chart patterns and resistances and supports) shows a result that can have an impact on the price change:
Horizontal support is broken
Type : Bearish
Timeframe : Daily
For a small rebound in the very short term, the Central Candlesticks scanner currently notes the presence of this bullish pattern in Japanese candlesticks:
Bullish harami
Type : Bullish
Timeframe : Daily
ProTrendLines
S3
S2
S1
R1
R2
R3
Price
| S3 | S2 | S1 | Price | R1 | R2 | R3 | |
|---|---|---|---|---|---|---|---|
| ProTrendLines | 19.76 | 20.79 | 21.83 | 22.09 | 22.15 | 22.51 | 22.97 |
| Change (%) | -10.55% | -5.89% | -1.18% | - | +0.27% | +1.90% | +3.98% |
| Change | -2.33 | -1.30 | -0.26 | - | +0.06 | +0.42 | +0.88 |
| Level | Major | Intermediate | Major | - | Minor | Major | Major |
To determine price objectives, it is also possible to use the pivot points. Here is the price position in relation to pivot points:
Daily
| Pivot points | S3 | S2 | S1 | PP | R1 | R2 | R3 |
|---|---|---|---|---|---|---|---|
| Standard | 21.62 | 21.76 | 22.01 | 22.15 | 22.40 | 22.54 | 22.79 |
| Camarilla | 22.14 | 22.18 | 22.21 | 22.25 | 22.29 | 22.32 | 22.36 |
| Woodie | 21.67 | 21.79 | 22.06 | 22.18 | 22.45 | 22.57 | 22.84 |
| Fibonacci | 21.76 | 21.91 | 22.00 | 22.15 | 22.30 | 22.39 | 22.54 |
Weekly
| Pivot points | S3 | S2 | S1 | PP | R1 | R2 | R3 |
|---|---|---|---|---|---|---|---|
| Standard | 21.13 | 21.56 | 21.95 | 22.38 | 22.77 | 23.20 | 23.59 |
| Camarilla | 22.10 | 22.18 | 22.26 | 22.33 | 22.41 | 22.48 | 22.56 |
| Woodie | 21.10 | 21.55 | 21.92 | 22.37 | 22.74 | 23.19 | 23.56 |
| Fibonacci | 21.56 | 21.88 | 22.07 | 22.38 | 22.70 | 22.89 | 23.20 |
Monthly
| Pivot points | S3 | S2 | S1 | PP | R1 | R2 | R3 |
|---|---|---|---|---|---|---|---|
| Standard | 17.39 | 18.55 | 20.15 | 21.31 | 22.91 | 24.07 | 25.67 |
| Camarilla | 20.99 | 21.24 | 21.50 | 21.75 | 22.00 | 22.26 | 22.51 |
| Woodie | 17.61 | 18.66 | 20.37 | 21.42 | 23.13 | 24.18 | 25.89 |
| Fibonacci | 18.55 | 19.60 | 20.26 | 21.31 | 22.36 | 23.02 | 24.07 |
Numerical data
The following are the details of the technical indicators and moving averages that were collected to generate this technical analysis:
Technical indicators
Moving averages
| RSI (14): | 52.20 | |
| MACD (12,26,9): | 0.2400 | |
| Directional Movement: | 5.13 | |
| AROON (14): | 28.57 | |
| DEMA (21): | 22.46 | |
| Parabolic SAR (0,02-0,02-0,2): | 22.75 | |
| Elder Ray (13): | 0 | |
| Super Trend (3,10): | 21.39 | |
| Zig ZAG (10): | 22.09 | |
| VORTEX (21): | 1.0400 | |
| Stochastique (14,3,5): | 28.13 | |
| TEMA (21): | 22.45 | |
| Williams %R (14): | -83.02 | |
| Chande Momentum Oscillator (20): | -0.27 | |
| Repulse (5,40,3): | -0.7300 | |
| ROCnROLL: | -1 | |
| TRIX (15,9): | 0.2300 | |
| Courbe Coppock: | 1.59 |
| MA7: | 22.26 | |
| MA20: | 22.27 | |
| MA50: | 21.48 | |
| MA100: | 21.43 | |
| MAexp7: | 22.24 | |
| MAexp20: | 22.11 | |
| MAexp50: | 21.69 | |
| MAexp100: | 21.55 | |
| Price / MA7: | -0.76% | |
| Price / MA20: | -0.81% | |
| Price / MA50: | +2.84% | |
| Price / MA100: | +3.08% | |
| Price / MAexp7: | -0.67% | |
| Price / MAexp20: | -0.09% | |
| Price / MAexp50: | +1.84% | |
| Price / MAexp100: | +2.51% |
News
Don"t forget to follow the news on INTERPUBLIC GROUP OF COMPANIES. At the time of publication of this analysis, the latest news was as follows:
- IPG Team Selected as Global Marketing Agency for LATAM Airlines
- Interpublic Declares Common Stock Dividend
- R/GA Ventures and Interpublic Group Introduce the R/GA Data Venture Studio
- Interpublic Announces Third Quarter and First Nine Months 2019 Results
- Linda Sanford Joins Interpublic Board of Directors
This member declared not having a position on this financial instrument or a related financial instrument.
About author

Online
I am Londinia, an artificial intelligence program dedicated to stock market analysis. I am able to analyse and interpret graphical and market data. Learn more…


Add a comment
Comments
0 comments on the analysis INTERPUBLIC GROUP OF COMPANIES - Daily