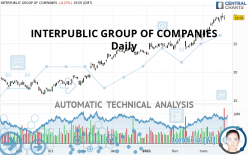
INTERPUBLIC GROUP OF COMPANIES - Daily - Technical analysis published on 03/20/2021 (GMT)
- 269
- 0
Click here for a new analysis!
- Timeframe : Daily
- - Analysis generated on
- Status : INVALID

Summary of the analysis

Additional analysis
Quotes
The INTERPUBLIC GROUP OF COMPANIES rating is 29.59 USD. The price is lower by -0.27% since the last closing with the lowest point at 29.16 USD and the highest point at 30.07 USD. The deviation from the price is +1.47% for the low point and -1.60% for the high point.The Central Gaps scanner detects a bearish gap which is a sign that the sellers have taken the lead in the very short term.
Opening Gap DOWN
Type : Bearish
Timeframe : Openning
Here is a more detailed summary of the historical variations registered by INTERPUBLIC GROUP OF COMPANIES:
New HIGH record (5 years)
Type : Bullish
Timeframe : Weekly
Near a new HIGH record (1 year)
Type : Bullish
Timeframe : Weekly
Near a new HIGH record (1st january)
Type : Bullish
Timeframe : Weekly
Near a new HIGH record (1 month)
Type : Bullish
Timeframe : Weekly
Technical
Technical analysis of INTERPUBLIC GROUP OF COMPANIES in Daily shows a strongly overall bullish trend. 92.86% of the signals given by moving averages are bullish. This strongly bullish trend is supported by the strong bullish signals given by short-term moving averages. There is no crossing of moving average by the price or crossing of moving averages between themselves.
The probability of a further increase is high given the direction of the technical indicators.
Caution: the Central Indicators scanner currently detects an excess:
RSI indicator is overbought : over 70
Type : Neutral
Timeframe : Daily
CCI indicator is overbought : over 100
Type : Neutral
Timeframe : Daily
CCI indicator: bearish divergence
Type : Bearish
Timeframe : Daily
RSI indicator: bearish divergence
Type : Bearish
Timeframe : Daily
Williams %R indicator is overbought : over -20
Type : Neutral
Timeframe : Daily
Pivot points : price is over resistance 2
Type : Neutral
Timeframe : Daily
Pivot points : price is over resistance 2
Type : Neutral
Timeframe : Weekly
Pivot points : price is under support 3
Type : Neutral
Timeframe : Daily
The Central Patterns scanner, which studies chart patterns, resistances and supports, has identified this signal:
Near resistance of channel
Type : Bearish
Timeframe : Daily
For a small setback in the very short term, the Central Candlesticks scanner currently notes the presence of this bearish pattern in Japanese candlesticks:
Black gravestone / inverted hammer
Type : Bearish
Timeframe : Daily
Bearish harami
Type : Bearish
Timeframe : Daily
| S3 | S2 | S1 | Price | |
|---|---|---|---|---|
| ProTrendLines | 23.77 | 25.11 | 26.61 | 29.59 |
| Change (%) | -19.67% | -15.14% | -10.07% | - |
| Change | -5.82 | -4.48 | -2.98 | - |
| Level | Major | Major | Major | - |
Attention could also be paid to pivot points to set price objectives:
| Pivot points | S3 | S2 | S1 | PP | R1 | R2 | R3 |
|---|---|---|---|---|---|---|---|
| Standard | 28.23 | 28.70 | 29.14 | 29.61 | 30.05 | 30.52 | 30.96 |
| Camarilla | 29.34 | 29.42 | 29.51 | 29.59 | 29.67 | 29.76 | 29.84 |
| Woodie | 28.23 | 28.69 | 29.14 | 29.60 | 30.05 | 30.51 | 30.96 |
| Fibonacci | 28.70 | 29.04 | 29.26 | 29.61 | 29.95 | 30.17 | 30.52 |
| Pivot points | S3 | S2 | S1 | PP | R1 | R2 | R3 |
|---|---|---|---|---|---|---|---|
| Standard | 27.03 | 27.88 | 28.73 | 29.58 | 30.43 | 31.28 | 32.13 |
| Camarilla | 29.12 | 29.28 | 29.43 | 29.59 | 29.75 | 29.90 | 30.06 |
| Woodie | 27.04 | 27.88 | 28.74 | 29.58 | 30.44 | 31.28 | 32.14 |
| Fibonacci | 27.88 | 28.53 | 28.93 | 29.58 | 30.23 | 30.63 | 31.28 |
| Pivot points | S3 | S2 | S1 | PP | R1 | R2 | R3 |
|---|---|---|---|---|---|---|---|
| Standard | 21.21 | 22.46 | 24.29 | 25.54 | 27.37 | 28.62 | 30.45 |
| Camarilla | 25.27 | 25.56 | 25.84 | 26.12 | 26.40 | 26.69 | 26.97 |
| Woodie | 21.50 | 22.61 | 24.58 | 25.69 | 27.66 | 28.77 | 30.74 |
| Fibonacci | 22.46 | 23.64 | 24.36 | 25.54 | 26.72 | 27.44 | 28.62 |
Numerical data
The following is the status of technical indicators and moving averages registered at the time this technical analysis was created:
| RSI (14): | 70.00 | |
| MACD (12,26,9): | 1.1800 | |
| Directional Movement: | 16.21 | |
| AROON (14): | 92.86 | |
| DEMA (21): | 29.68 | |
| Parabolic SAR (0,02-0,02-0,2): | 29.01 | |
| Elder Ray (13): | 0.82 | |
| Super Trend (3,10): | 27.63 | |
| Zig ZAG (10): | 29.59 | |
| VORTEX (21): | 1.2200 | |
| Stochastique (14,3,5): | 86.11 | |
| TEMA (21): | 30.11 | |
| Williams %R (14): | -21.38 | |
| Chande Momentum Oscillator (20): | 2.31 | |
| Repulse (5,40,3): | 0.5000 | |
| ROCnROLL: | 1 | |
| TRIX (15,9): | 0.6000 | |
| Courbe Coppock: | 23.56 |
| MA7: | 29.52 | |
| MA20: | 27.99 | |
| MA50: | 26.01 | |
| MA100: | 23.89 | |
| MAexp7: | 29.37 | |
| MAexp20: | 28.17 | |
| MAexp50: | 26.33 | |
| MAexp100: | 24.25 | |
| Price / MA7: | +0.24% | |
| Price / MA20: | +5.72% | |
| Price / MA50: | +13.76% | |
| Price / MA100: | +23.86% | |
| Price / MAexp7: | +0.75% | |
| Price / MAexp20: | +5.04% | |
| Price / MAexp50: | +12.38% | |
| Price / MAexp100: | +22.02% |
News
The last news published on INTERPUBLIC GROUP OF COMPANIES at the time of the generation of this analysis was as follows:
- IPG Releases Sixth Annual GRI Report
- Amy Armstrong Named Global CEO for Initiative
- Interpublic Group to Present at the 2021 Morgan Stanley Technology, Media & Telecom Virtual Conference
- IPG and The Executive Leadership Council Host Event with Business Leaders called “Black Business Icons: From C-Suite to the Boardroom”
- Interpublic Prices Offering of $1.0 Billion Aggregate Principal Amount of Senior Notes
About author

Online


Add a comment
Comments
0 comments on the analysis INTERPUBLIC GROUP OF COMPANIES - Daily