FIRST CITIZENS BANCSHARES INC. - 1H - Technical analysis published on 04/25/2024 (GMT)
- 97
- 0
- Timeframe : 1H
- - Analysis generated on
- Status : WITHOUT TARGET

Summary of the analysis

Additional analysis
Quotes
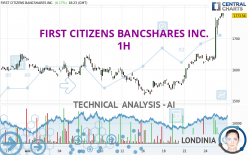
FIRST CITIZENS BANCSHARES INC. rating 1,769.14 USD. On the day, this instrument gained +7.90% and was between 1,634.91 USD and 1,781.74 USD. This implies that the price is at +8.21% from its lowest and at -0.71% from its highest.The Central Gaps scanner detects a bearish opening. A small advantage for sellers in the very short term.
Bearish opening
Type : Bearish
Timeframe : Openning
Here is a more detailed summary of the historical variations registered by FIRST CITIZENS BANCSHARES INC.:
New HIGH record (5 years)
Type : Bullish
Timeframe : Weekly
New HIGH record (1 year)
Type : Bullish
Timeframe : Weekly
New HIGH record (1st january)
Type : Bullish
Timeframe : Weekly
New HIGH record (1 month)
Type : Bullish
Timeframe : Weekly
Technical
Technical analysis of FIRST CITIZENS BANCSHARES INC. in 1H shows a strongly overall bullish trend. The signals given by the moving averages are 92.86% bullish. This strong bullish trend is confirmed by the strong signals currently being given by short-term moving averages. There is no crossing of moving average by the price or crossing of moving averages between themselves.
In fact, 15 technical indicators on 18 studied are currently bullish. Caution: the Central Indicators scanner currently detects an excess:
RSI indicator is overbought : over 80
Type : Neutral
Timeframe : 1 hour
CCI indicator is overbought : over 100
Type : Neutral
Timeframe : 1 hour
Williams %R indicator is overbought : over -20
Type : Neutral
Timeframe : 1 hour
Pivot points : price is over resistance 3
Type : Neutral
Timeframe : 1 hour
Pivot points : price is over resistance 3
Type : Neutral
Timeframe : Weekly
Central Patterns, the market scanner focusing on chart patterns, resistances and supports found this result:
Resistance of channel is broken
Type : Bullish
Timeframe : 1 hour
The presence of a bearish pattern in Japanese candlesticks detected by Central Candlesticks that could cause a correction in the very short term was also detected:
Dark cloud cover
Type : Bearish
Timeframe : 1 hour
| S3 | S2 | S1 | Price | |
|---|---|---|---|---|
| ProTrendLines | 1,619.06 | 1,634.45 | 1,651.89 | 1,769.14 |
| Change (%) | -8.48% | -7.61% | -6.63% | - |
| Change | -150.08 | -134.69 | -117.25 | - |
| Level | Intermediate | Intermediate | Intermediate | - |
Attention could also be paid to pivot points to set price objectives:
| Pivot points | S3 | S2 | S1 | PP | R1 | R2 | R3 |
|---|---|---|---|---|---|---|---|
| Standard | 1,601.50 | 1,613.28 | 1,626.45 | 1,638.23 | 1,651.40 | 1,663.18 | 1,676.35 |
| Camarilla | 1,632.77 | 1,635.06 | 1,637.34 | 1,639.63 | 1,641.92 | 1,644.20 | 1,646.49 |
| Woodie | 1,602.21 | 1,613.63 | 1,627.16 | 1,638.58 | 1,652.11 | 1,663.53 | 1,677.06 |
| Fibonacci | 1,613.28 | 1,622.81 | 1,628.70 | 1,638.23 | 1,647.76 | 1,653.65 | 1,663.18 |
| Pivot points | S3 | S2 | S1 | PP | R1 | R2 | R3 |
|---|---|---|---|---|---|---|---|
| Standard | 1,452.22 | 1,485.11 | 1,526.23 | 1,559.12 | 1,600.24 | 1,633.13 | 1,674.25 |
| Camarilla | 1,547.01 | 1,553.79 | 1,560.58 | 1,567.36 | 1,574.14 | 1,580.93 | 1,587.71 |
| Woodie | 1,456.35 | 1,487.17 | 1,530.36 | 1,561.18 | 1,604.37 | 1,635.19 | 1,678.38 |
| Fibonacci | 1,485.11 | 1,513.38 | 1,530.85 | 1,559.12 | 1,587.39 | 1,604.86 | 1,633.13 |
| Pivot points | S3 | S2 | S1 | PP | R1 | R2 | R3 |
|---|---|---|---|---|---|---|---|
| Standard | 1,397.24 | 1,451.49 | 1,543.24 | 1,597.49 | 1,689.24 | 1,743.49 | 1,835.24 |
| Camarilla | 1,594.85 | 1,608.23 | 1,621.62 | 1,635.00 | 1,648.38 | 1,661.77 | 1,675.15 |
| Woodie | 1,416.00 | 1,460.87 | 1,562.00 | 1,606.87 | 1,708.00 | 1,752.87 | 1,854.00 |
| Fibonacci | 1,451.49 | 1,507.26 | 1,541.72 | 1,597.49 | 1,653.26 | 1,687.72 | 1,743.49 |
Numerical data
The following is the status of the technical indicators and moving averages at the time of publication of this technical analysis:
| RSI (14): | 82.22 | |
| MACD (12,26,9): | 46.1400 | |
| Directional Movement: | 39.96 | |
| AROON (14): | 92.86 | |
| DEMA (21): | 1,742.72 | |
| Parabolic SAR (0,02-0,02-0,2): | 1,642.12 | |
| Elder Ray (13): | 60.81 | |
| Super Trend (3,10): | 1,706.97 | |
| Zig ZAG (10): | 1,772.55 | |
| VORTEX (21): | 1.3400 | |
| Stochastique (14,3,5): | 97.88 | |
| TEMA (21): | 1,768.99 | |
| Williams %R (14): | -5.64 | |
| Chande Momentum Oscillator (20): | 145.16 | |
| Repulse (5,40,3): | 1.9300 | |
| ROCnROLL: | 1 | |
| TRIX (15,9): | 0.3000 | |
| Courbe Coppock: | 13.31 |
| MA7: | 1,618.13 | |
| MA20: | 1,600.61 | |
| MA50: | 1,574.83 | |
| MA100: | 1,508.04 | |
| MAexp7: | 1,745.41 | |
| MAexp20: | 1,687.61 | |
| MAexp50: | 1,635.66 | |
| MAexp100: | 1,610.99 | |
| Price / MA7: | +9.33% | |
| Price / MA20: | +10.53% | |
| Price / MA50: | +12.34% | |
| Price / MA100: | +17.31% | |
| Price / MAexp7: | +1.36% | |
| Price / MAexp20: | +4.83% | |
| Price / MAexp50: | +8.16% | |
| Price / MAexp100: | +9.82% |
News
Don't forget to follow the news on FIRST CITIZENS BANCSHARES INC.. At the time of publication of this analysis, the latest news was as follows:
- First Citizens Launches Streamlined Solution for Securities-Based Lines of Credit
- Nolan Joins First Citizens as Director of Investment Strategy
- Biliter Joins First Citizens Investor Services as President
- Gilland Joins First Citizens Bank as Director of Private Banking
- First Citizens Wealth Management Selects Envestnet for Integrated Intelligent Platform
About author
Online


Add a comment
Comments
0 comments on the analysis FIRST CITIZENS BANCSHARES INC. - 1H