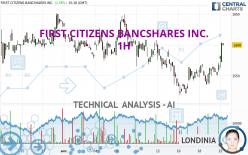
FIRST CITIZENS BANCSHARES INC. - 1H - Technical analysis published on 04/22/2024 (GMT)
- 102
- 0
Click here for a new analysis!
- Timeframe : 1H
- - Analysis generated on
- Status : TARGET REACHED

Summary of the analysis

Additional analysis
Quotes
The FIRST CITIZENS BANCSHARES INC. rating is 1,600.00 USD. The price has increased by +2.08% since the last closing with the lowest point at 1,562.65 USD and the highest point at 1,603.48 USD. The deviation from the price is +2.39% for the low point and -0.22% for the high point.The Central Gaps scanner detects the formation of a bullish gap marking the strong presence of buyers against sellers at the opening. This formed a quotation gap.
Opening Gap UP
Type : Bullish
Timeframe : Openning
A study of price movements over other periods shows the following variations:
Near a new HIGH record (5 years)
Type : Bullish
Timeframe : Weekly
Near a new HIGH record (1 year)
Type : Bullish
Timeframe : Weekly
Near a new HIGH record (1st january)
Type : Bullish
Timeframe : Weekly
Near a new HIGH record (1 month)
Type : Bullish
Timeframe : Weekly
Technical
Technical analysis of FIRST CITIZENS BANCSHARES INC. in 1H shows an overall bullish trend. 75.00% of the signals given by moving averages are bullish. This bullish trend is supported by the strong bullish signals given by short-term moving averages. The Central Indicators scanner detects bullish signals on moving averages that could impact this trend:
Bullish trend reversal : Moving Average 50
Type : Bullish
Timeframe : 1 hour
Moving Average bullish crossovers : MA20 & MA50
Type : Bullish
Timeframe : 1 hour
In fact, 16 technical indicators on 18 studied are currently bullish. Caution: the Central Indicators scanner currently detects an excess:
CCI indicator is overbought : over 100
Type : Neutral
Timeframe : 1 hour
Previous candle closed over Bollinger bands
Type : Neutral
Timeframe : 1 hour
Williams %R indicator is overbought : over -20
Type : Neutral
Timeframe : 1 hour
Pivot points : price is over resistance 2
Type : Neutral
Timeframe : 1 hour
An analysis of the price chart with the Central Patterns scanner (detector of chart patterns and resistances and supports) shows a result that can have an impact on the price change:
Near resistance of channel
Type : Bearish
Timeframe : 1 hour
Central Candlesticks, the scanner specialised in Japanese candlesticks, detects these signals that could have an impact on the current short-term trend:
Bearish harami
Type : Bearish
Timeframe : 1 hour
Doji
Type : Neutral
Timeframe : 1 hour
Bearish harami cross
Type : Bearish
Timeframe : 1 hour
| S3 | S2 | S1 | Price | R1 | R2 | R3 | |
|---|---|---|---|---|---|---|---|
| ProTrendLines | 1,507.95 | 1,537.97 | 1,567.15 | 1,600.00 | 1,600.87 | 1,634.45 | 1,651.73 |
| Change (%) | -5.75% | -3.88% | -2.05% | - | +0.05% | +2.15% | +3.23% |
| Change | -92.05 | -62.03 | -32.85 | - | +0.87 | +34.45 | +51.73 |
| Level | Major | Minor | Major | - | Intermediate | Major | Minor |
Attention could also be paid to pivot points to set price objectives:
| Pivot points | S3 | S2 | S1 | PP | R1 | R2 | R3 |
|---|---|---|---|---|---|---|---|
| Standard | 1,511.29 | 1,523.90 | 1,545.63 | 1,558.24 | 1,579.97 | 1,592.58 | 1,614.31 |
| Camarilla | 1,557.92 | 1,561.06 | 1,564.21 | 1,567.36 | 1,570.51 | 1,573.66 | 1,576.80 |
| Woodie | 1,515.85 | 1,526.18 | 1,550.19 | 1,560.52 | 1,584.53 | 1,594.86 | 1,618.87 |
| Fibonacci | 1,523.90 | 1,537.02 | 1,545.12 | 1,558.24 | 1,571.36 | 1,579.46 | 1,592.58 |
| Pivot points | S3 | S2 | S1 | PP | R1 | R2 | R3 |
|---|---|---|---|---|---|---|---|
| Standard | 1,452.22 | 1,485.11 | 1,526.23 | 1,559.12 | 1,600.24 | 1,633.13 | 1,674.25 |
| Camarilla | 1,547.01 | 1,553.79 | 1,560.58 | 1,567.36 | 1,574.14 | 1,580.93 | 1,587.71 |
| Woodie | 1,456.35 | 1,487.17 | 1,530.36 | 1,561.18 | 1,604.37 | 1,635.19 | 1,678.38 |
| Fibonacci | 1,485.11 | 1,513.38 | 1,530.85 | 1,559.12 | 1,587.39 | 1,604.86 | 1,633.13 |
| Pivot points | S3 | S2 | S1 | PP | R1 | R2 | R3 |
|---|---|---|---|---|---|---|---|
| Standard | 1,397.24 | 1,451.49 | 1,543.24 | 1,597.49 | 1,689.24 | 1,743.49 | 1,835.24 |
| Camarilla | 1,594.85 | 1,608.23 | 1,621.62 | 1,635.00 | 1,648.38 | 1,661.77 | 1,675.15 |
| Woodie | 1,416.00 | 1,460.87 | 1,562.00 | 1,606.87 | 1,708.00 | 1,752.87 | 1,854.00 |
| Fibonacci | 1,451.49 | 1,507.26 | 1,541.72 | 1,597.49 | 1,653.26 | 1,687.72 | 1,743.49 |
Numerical data
The following is the status of the technical indicators and moving averages at the time of publication of this technical analysis:
| RSI (14): | 68.26 | |
| MACD (12,26,9): | 8.0900 | |
| Directional Movement: | 18.40 | |
| AROON (14): | 71.43 | |
| DEMA (21): | 1,573.47 | |
| Parabolic SAR (0,02-0,02-0,2): | 1,542.17 | |
| Elder Ray (13): | 31.73 | |
| Super Trend (3,10): | 1,563.98 | |
| Zig ZAG (10): | 1,602.84 | |
| VORTEX (21): | 1.2000 | |
| Stochastique (14,3,5): | 96.21 | |
| TEMA (21): | 1,584.05 | |
| Williams %R (14): | -7.75 | |
| Chande Momentum Oscillator (20): | 56.82 | |
| Repulse (5,40,3): | 1.7300 | |
| ROCnROLL: | 1 | |
| TRIX (15,9): | 0.0200 | |
| Courbe Coppock: | 2.89 |
| MA7: | 1,558.36 | |
| MA20: | 1,588.78 | |
| MA50: | 1,562.94 | |
| MA100: | 1,500.75 | |
| MAexp7: | 1,580.10 | |
| MAexp20: | 1,565.95 | |
| MAexp50: | 1,566.17 | |
| MAexp100: | 1,574.02 | |
| Price / MA7: | +2.67% | |
| Price / MA20: | +0.71% | |
| Price / MA50: | +2.37% | |
| Price / MA100: | +6.61% | |
| Price / MAexp7: | +1.26% | |
| Price / MAexp20: | +2.17% | |
| Price / MAexp50: | +2.16% | |
| Price / MAexp100: | +1.65% |
News
The latest news and videos published on FIRST CITIZENS BANCSHARES INC. at the time of the analysis were as follows:
- First Citizens Launches Streamlined Solution for Securities-Based Lines of Credit
- Nolan Joins First Citizens as Director of Investment Strategy
- Biliter Joins First Citizens Investor Services as President
- Gilland Joins First Citizens Bank as Director of Private Banking
- First Citizens Wealth Management Selects Envestnet for Integrated Intelligent Platform
About author
Online


Add a comment
Comments
0 comments on the analysis FIRST CITIZENS BANCSHARES INC. - 1H