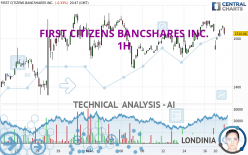
FIRST CITIZENS BANCSHARES INC. - 1H - Technical analysis published on 02/20/2024 (GMT)
- 77
- 0
Click here for a new analysis!
- Timeframe : 1H
- - Analysis generated on
- Status : LEVEL MAINTAINED

Summary of the analysis

Additional analysis
Quotes
The FIRST CITIZENS BANCSHARES INC. rating is 1,512.53 USD. On the day, this instrument lost -0.16% and was traded between 1,475.85 USD and 1,525.92 USD over the period. The price is currently at +2.49% from its lowest and -0.88% from its highest.A bearish gap was detected at the opening by the Central Gaps scanner. There are a lot of sellers and they have the upper hand in the very short term.
Opening Gap DOWN
Type : Bearish
Timeframe : Openning
Here is a more detailed summary of the historical variations registered by FIRST CITIZENS BANCSHARES INC.:
Near a new HIGH record (5 years)
Type : Bullish
Timeframe : Weekly
Near a new HIGH record (1 year)
Type : Bullish
Timeframe : Weekly
Near a new HIGH record (1st january)
Type : Bullish
Timeframe : Weekly
Near a new HIGH record (1 month)
Type : Bullish
Timeframe : Weekly
Technical
A technical analysis in 1H of this FIRST CITIZENS BANCSHARES INC. chart shows a bullish trend. 64.29% of the signals given by moving averages are bullish. Caution: the neutral signals currently given by the short-term moving averages indicate that this bullish trend is showing signs of running out of steam. The Central Indicators market scanner is currently detecting several bearish signals that could impact this trend:
Bearish trend reversal : Moving Average 100
Type : Bearish
Timeframe : 1 hour
Bearish price crossover with Moving Average 20
Type : Bearish
Timeframe : 1 hour
In fact, of the 18 technical indicators analysed by Central Analyzer, 6 are bullish, 7 are neutral and 5 are bearish. But beware of excesses. The Central Indicators scanner currently detects this:
MACD indicator: bearish divergence
Type : Bearish
Timeframe : 1 hour
Price is back over the pivot point
Type : Bullish
Timeframe : Weekly
Price is back under the pivot point
Type : Bearish
Timeframe : 1 hour
The Central Patterns scanner, which studies chart patterns, resistances and supports, has identified this signal:
Near resistance of triangle
Type : Bearish
Timeframe : 1 hour
No result was found by the Central Candlesticks scanner on Japanese candlesticks.
| S3 | S2 | S1 | Price | R1 | R2 | |
|---|---|---|---|---|---|---|
| ProTrendLines | 1,438.08 | 1,460.79 | 1,509.50 | 1,512.53 | 1,536.69 | 1,551.84 |
| Change (%) | -4.92% | -3.42% | -0.20% | - | +1.60% | +2.60% |
| Change | -74.45 | -51.74 | -3.03 | - | +24.16 | +39.31 |
| Level | Minor | Intermediate | Major | - | Major | Intermediate |
To determine price objectives, it is also possible to use the pivot points. Here is the price position in relation to pivot points:
| Pivot points | S3 | S2 | S1 | PP | R1 | R2 | R3 |
|---|---|---|---|---|---|---|---|
| Standard | 1,483.90 | 1,498.57 | 1,506.78 | 1,521.45 | 1,529.66 | 1,544.33 | 1,552.54 |
| Camarilla | 1,508.70 | 1,510.80 | 1,512.89 | 1,514.99 | 1,517.09 | 1,519.19 | 1,521.28 |
| Woodie | 1,480.67 | 1,496.96 | 1,503.55 | 1,519.84 | 1,526.43 | 1,542.72 | 1,549.31 |
| Fibonacci | 1,498.57 | 1,507.31 | 1,512.71 | 1,521.45 | 1,530.19 | 1,535.59 | 1,544.33 |
| Pivot points | S3 | S2 | S1 | PP | R1 | R2 | R3 |
|---|---|---|---|---|---|---|---|
| Standard | 1,396.43 | 1,428.60 | 1,471.79 | 1,503.96 | 1,547.15 | 1,579.32 | 1,622.51 |
| Camarilla | 1,494.27 | 1,501.17 | 1,508.08 | 1,514.99 | 1,521.90 | 1,528.81 | 1,535.71 |
| Woodie | 1,401.95 | 1,431.36 | 1,477.31 | 1,506.72 | 1,552.67 | 1,582.08 | 1,628.03 |
| Fibonacci | 1,428.60 | 1,457.38 | 1,475.17 | 1,503.96 | 1,532.74 | 1,550.53 | 1,579.32 |
| Pivot points | S3 | S2 | S1 | PP | R1 | R2 | R3 |
|---|---|---|---|---|---|---|---|
| Standard | 1,211.24 | 1,287.61 | 1,398.80 | 1,475.17 | 1,586.36 | 1,662.73 | 1,773.92 |
| Camarilla | 1,458.42 | 1,475.61 | 1,492.81 | 1,510.00 | 1,527.19 | 1,544.39 | 1,561.58 |
| Woodie | 1,228.66 | 1,296.32 | 1,416.22 | 1,483.88 | 1,603.78 | 1,671.44 | 1,791.34 |
| Fibonacci | 1,287.61 | 1,359.26 | 1,403.52 | 1,475.17 | 1,546.82 | 1,591.08 | 1,662.73 |
Numerical data
The following are the details of the technical indicators and moving averages that were collected to generate this technical analysis:
| RSI (14): | 49.23 | |
| MACD (12,26,9): | 3.6600 | |
| Directional Movement: | -4.31 | |
| AROON (14): | -35.71 | |
| DEMA (21): | 1,517.74 | |
| Parabolic SAR (0,02-0,02-0,2): | 1,476.86 | |
| Elder Ray (13): | 0.78 | |
| Super Trend (3,10): | 1,528.21 | |
| Zig ZAG (10): | 1,507.73 | |
| VORTEX (21): | 0.9800 | |
| Stochastique (14,3,5): | 69.27 | |
| TEMA (21): | 1,517.78 | |
| Williams %R (14): | -41.18 | |
| Chande Momentum Oscillator (20): | -16.58 | |
| Repulse (5,40,3): | -0.2400 | |
| ROCnROLL: | -1 | |
| TRIX (15,9): | 0.0500 | |
| Courbe Coppock: | 1.02 |
| MA7: | 1,502.84 | |
| MA20: | 1,490.41 | |
| MA50: | 1,447.13 | |
| MA100: | 1,419.25 | |
| MAexp7: | 1,514.83 | |
| MAexp20: | 1,511.98 | |
| MAexp50: | 1,504.31 | |
| MAexp100: | 1,493.94 | |
| Price / MA7: | +0.64% | |
| Price / MA20: | +1.48% | |
| Price / MA50: | +4.52% | |
| Price / MA100: | +6.57% | |
| Price / MAexp7: | -0.15% | |
| Price / MAexp20: | +0.04% | |
| Price / MAexp50: | +0.55% | |
| Price / MAexp100: | +1.24% |
News
The latest news and videos published on FIRST CITIZENS BANCSHARES INC. at the time of the analysis were as follows:
- First Citizens Launches Streamlined Solution for Securities-Based Lines of Credit
- Nolan Joins First Citizens as Director of Investment Strategy
- Biliter Joins First Citizens Investor Services as President
- Gilland Joins First Citizens Bank as Director of Private Banking
- First Citizens Wealth Management Selects Envestnet for Integrated Intelligent Platform
About author
Online


Add a comment
Comments
0 comments on the analysis FIRST CITIZENS BANCSHARES INC. - 1H