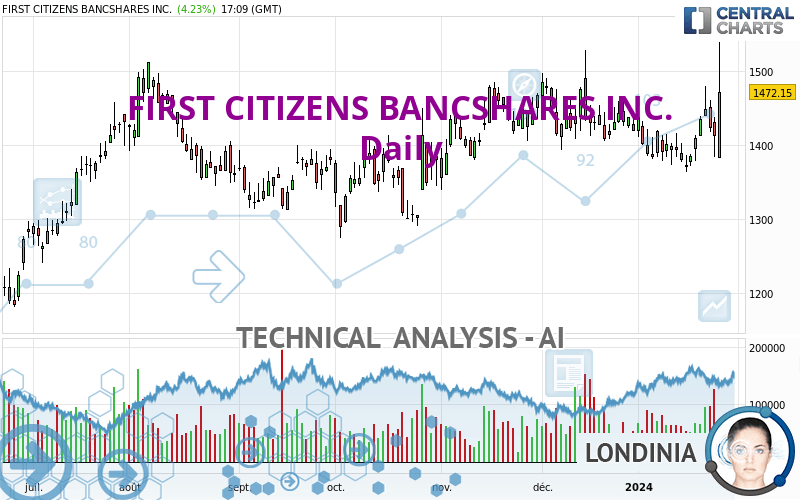
FIRST CITIZENS BANCSHARES INC. - Daily - Technical analysis published on 01/26/2024 (GMT)
- 93
- 0
Click here for a new analysis!
- Timeframe : Daily
- - Analysis generated on
- Status : TARGET REACHED

Summary of the analysis

Additional analysis
Quotes
The FIRST CITIZENS BANCSHARES INC. price is 1,472.15 USD. The price has increased by +4.23% since the last closing and was between 1,383.00 USD and 1,539.51 USD. This implies that the price is at +6.45% from its lowest and at -4.38% from its highest.The Central Gaps scanner detects the formation of a bearish gap marking the strong presence of sellers ahead of buyers at the opening. This formed a quotation gap.
Opening Gap DOWN
Type : Bearish
Timeframe : Openning
So that you have an overall view of the price change, here is a table showing the variations over several periods:
New HIGH record (5 years)
Type : Bullish
Timeframe : Weekly
New HIGH record (1 year)
Type : Bullish
Timeframe : Weekly
New HIGH record (1st january)
Type : Bullish
Timeframe : Weekly
New HIGH record (1 month)
Type : Bullish
Timeframe : Weekly
Technical
Technical analysis of FIRST CITIZENS BANCSHARES INC. in Daily shows a strongly overall bullish trend. 89.29% of the signals given by moving averages are bullish. This strongly bullish trend is supported by the strong bullish signals given by short-term moving averages. The Central Indicators scanner detects a bullish signal on moving averages that could impact this trend:
Bullish price crossover with Moving Average 50
Type : Bullish
Timeframe : Daily
An assessment of technical indicators shows a moderate bullish signal.
Caution: the Central Indicators scanner currently detects an excess:
CCI indicator is overbought : over 100
Type : Neutral
Timeframe : Daily
Pivot points : price is over resistance 2
Type : Neutral
Timeframe : Daily
Pivot points : price is over resistance 2
Type : Neutral
Timeframe : Weekly
RSI indicator is back over 50
Type : Bullish
Timeframe : Daily
Ichimoku : price is over the cloud
Type : Bullish
Timeframe : Daily
SuperTrend indicator bullish reversal
Type : Bullish
Timeframe : Daily
MACD indicator is back over 0
Type : Bullish
Timeframe : Daily
Momentum indicator is back over 0
Type : Bullish
Timeframe : Daily
Williams %R indicator is back over -50
Type : Bullish
Timeframe : Daily
Central Patterns, the market scanner focusing on chart patterns, resistances and supports found these results:
Horizontal resistance is broken
Type : Bullish
Timeframe : Daily
Resistance of channel is broken
Type : Bullish
Timeframe : Daily
Resistance of triangle is broken
Type : Bullish
Timeframe : Daily
Central Candlesticks, the scanner specialised in Japanese candlesticks, detects these bullish signals that could support the hypothesis of a small rebound in the very short term:
White line without lower shadow
Type : Bullish
Timeframe : Daily
Bullish engulfing lines
Type : Bullish
Timeframe : Daily
Long white line
Type : Bullish
Timeframe : Daily
| S3 | S2 | S1 | Price | R1 | |
|---|---|---|---|---|---|
| ProTrendLines | 1,288.64 | 1,375.97 | 1,442.19 | 1,472.15 | 1,509.50 |
| Change (%) | -12.47% | -6.53% | -2.04% | - | +2.54% |
| Change | -183.51 | -96.18 | -29.96 | - | +37.35 |
| Level | Intermediate | Major | Intermediate | - | Major |
Attention could also be paid to pivot points to set price objectives:
| Pivot points | S3 | S2 | S1 | PP | R1 | R2 | R3 |
|---|---|---|---|---|---|---|---|
| Standard | 1,330.92 | 1,357.67 | 1,385.04 | 1,411.79 | 1,439.16 | 1,465.91 | 1,493.28 |
| Camarilla | 1,397.53 | 1,402.49 | 1,407.45 | 1,412.41 | 1,417.37 | 1,422.33 | 1,427.29 |
| Woodie | 1,331.23 | 1,357.83 | 1,385.35 | 1,411.95 | 1,439.47 | 1,466.07 | 1,493.59 |
| Fibonacci | 1,357.67 | 1,378.34 | 1,391.12 | 1,411.79 | 1,432.46 | 1,445.24 | 1,465.91 |
| Pivot points | S3 | S2 | S1 | PP | R1 | R2 | R3 |
|---|---|---|---|---|---|---|---|
| Standard | 1,327.76 | 1,345.87 | 1,377.77 | 1,395.88 | 1,427.78 | 1,445.89 | 1,477.79 |
| Camarilla | 1,395.93 | 1,400.51 | 1,405.10 | 1,409.68 | 1,414.26 | 1,418.85 | 1,423.43 |
| Woodie | 1,334.67 | 1,349.32 | 1,384.68 | 1,399.33 | 1,434.69 | 1,449.34 | 1,484.70 |
| Fibonacci | 1,345.87 | 1,364.97 | 1,376.77 | 1,395.88 | 1,414.98 | 1,426.78 | 1,445.89 |
| Pivot points | S3 | S2 | S1 | PP | R1 | R2 | R3 |
|---|---|---|---|---|---|---|---|
| Standard | 1,231.32 | 1,312.51 | 1,365.74 | 1,446.93 | 1,500.16 | 1,581.35 | 1,634.58 |
| Camarilla | 1,382.01 | 1,394.33 | 1,406.65 | 1,418.97 | 1,431.29 | 1,443.61 | 1,455.94 |
| Woodie | 1,217.34 | 1,305.52 | 1,351.76 | 1,439.94 | 1,486.18 | 1,574.36 | 1,620.60 |
| Fibonacci | 1,312.51 | 1,363.86 | 1,395.58 | 1,446.93 | 1,498.28 | 1,530.00 | 1,581.35 |
Numerical data
The following is the status of the technical indicators and moving averages at the time of publication of this technical analysis:
| RSI (14): | 60.67 | |
| MACD (12,26,9): | 3.7600 | |
| Directional Movement: | 18.19 | |
| AROON (14): | 50.00 | |
| DEMA (21): | 1,420.62 | |
| Parabolic SAR (0,02-0,02-0,2): | 1,378.74 | |
| Elder Ray (13): | 39.86 | |
| Super Trend (3,10): | 1,318.94 | |
| Zig ZAG (10): | 1,474.14 | |
| VORTEX (21): | 0.9200 | |
| Stochastique (14,3,5): | 51.82 | |
| TEMA (21): | 1,425.58 | |
| Williams %R (14): | -37.24 | |
| Chande Momentum Oscillator (20): | 83.62 | |
| Repulse (5,40,3): | 3.9900 | |
| ROCnROLL: | 1 | |
| TRIX (15,9): | -0.0500 | |
| Courbe Coppock: | 2.70 |
| MA7: | 1,426.27 | |
| MA20: | 1,411.09 | |
| MA50: | 1,429.42 | |
| MA100: | 1,394.18 | |
| MAexp7: | 1,429.25 | |
| MAexp20: | 1,418.89 | |
| MAexp50: | 1,414.88 | |
| MAexp100: | 1,384.15 | |
| Price / MA7: | +3.22% | |
| Price / MA20: | +4.33% | |
| Price / MA50: | +2.99% | |
| Price / MA100: | +5.59% | |
| Price / MAexp7: | +3.00% | |
| Price / MAexp20: | +3.75% | |
| Price / MAexp50: | +4.05% | |
| Price / MAexp100: | +6.36% |
News
The last news published on FIRST CITIZENS BANCSHARES INC. at the time of the generation of this analysis was as follows:
- First Citizens Launches Streamlined Solution for Securities-Based Lines of Credit
- Nolan Joins First Citizens as Director of Investment Strategy
- Biliter Joins First Citizens Investor Services as President
- Gilland Joins First Citizens Bank as Director of Private Banking
- First Citizens Wealth Management Selects Envestnet for Integrated Intelligent Platform
About author
Online


Add a comment
Comments
0 comments on the analysis FIRST CITIZENS BANCSHARES INC. - Daily