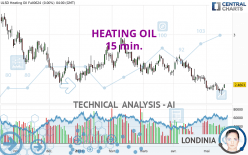
HEATING OIL - 15 min. - Technical analysis published on 05/20/2024 (GMT)
- 61
- 0
Oops, I was wrong about that analysis. My threshold for invalidation has been broken.
Click here for a new analysis!
Click here for a new analysis!
- Timeframe : 15 min.
- - Analysis generated on
- Status : INVALID

Summary of the analysis
Trends
Short term:
Bullish
Underlying:
Strongly bullish
Technical indicators
50%
17%
33%
My opinion
Bullish above 2.4765 USD
My targets
2.5022 USD (+0.65%)
2.5180 USD (+1.28%)
My analysis
All elements being clearly bullish, it would be possible for traders to trade only long positions (at the time of purchase) on HEATING OIL as long as the price remains well above 2.4765 USD. The buyers' bullish objective is set at 2.5022 USD. A bullish break in this resistance would boost the bullish momentum. The buyers could then target the resistance located at 2.5180 USD. If there is any crossing, the next objective would be the resistance located at 2.5437 USD. Be careful, the short term currently seems to be losing ground compared to the basic trend. Longer time units should be analysed to identify possible overbought items that could be a sign of a possible short-term correction.
Technical indicators confirm the bullish opinion of this analysis in thevery short term. However, be careful of excessive bullish movements. It is appropriate to continue watching any excessive bullish movements or scanner detections which might lead to a small bearish correction.
Force
0
10
5.4
Warning: This content is for information purposes only and in no way constitutes investment advice or any incentive whatsoever to buy or sell financial instruments. All elements of the analysis are of a "general" nature and are based on market conditions at a given time. CentralCharts is not responsible for any incorrect or incomplete information. Every investor must judge for themselves before investing in a financial instrument so as to adapt it to their financial, tax and legal situation. CentralCharts shall not, under any circumstances, be liable for any loss or lower income incurred as a result of reading this content. Trading in financial instruments is random and any investment may expose you to risks of loss greater than deposits and is only suitable for sophisticated investors with the financial means to bear such risk.

This analysis was given by Barts_XV. Take part yourself by sharing additional analysis on another time unit:
Additional analysis
Quotes
The HEATING OIL rating is 2.4861 USD. The price is lower by -0.01% since the last closing and was between 2.4769 USD and 2.4914 USD. This implies that the price is at +0.37% from its lowest and at -0.21% from its highest.2.4769
2.4914
2.4861
A bullish opening was detected by the Central Gaps scanner. Buyers are trying to impose a bullish momentum in the very short term.
Bullish opening
Type : Bullish
Timeframe : Openning
A study of price movements over other periods shows the following variations:
Technical
A technical analysis in 15 min. of this HEATING OIL chart shows a strongly bullish trend. The signals given by moving averages are 82.14% bullish. This strongly bullish trend seems to be running out of steam given the signals being given by short-term moving averages. An assessment of moving averages reveals a bullish signal that could impact this trend:
Bullish trend reversal : Moving Average 20
Type : Bullish
Timeframe : 15 minutes
An assessment of technical indicators shows a slightly bullish signal.
No additional result has been identified by Central Indicators, the scanner specialised in technical indicators.
Central Patterns, the scanner specializing in chart patterns, did not identify any signals.
No result was found by the Central Candlesticks scanner on Japanese candlesticks.
ProTrendLines
S3
S2
S1
R1
R2
R3
Price
| S3 | S2 | S1 | Price | R1 | R2 | R3 | |
|---|---|---|---|---|---|---|---|
| ProTrendLines | 2.4106 | 2.4266 | 2.4568 | 2.4861 | 2.4905 | 2.5102 | 2.6154 |
| Change (%) | -3.04% | -2.39% | -1.18% | - | +0.18% | +0.97% | +5.20% |
| Change | -0.0755 | -0.0595 | -0.0293 | - | +0.0044 | +0.0241 | +0.1293 |
| Level | Major | Intermediate | Major | - | Minor | Major | Major |
Pivot points can also be used to set your price objectives. Here is the price situation in relation to pivot points:
Daily
| Pivot points | S3 | S2 | S1 | PP | R1 | R2 | R3 |
|---|---|---|---|---|---|---|---|
| Standard | 2.4192 | 2.4350 | 2.4607 | 2.4765 | 2.5022 | 2.5180 | 2.5437 |
| Camarilla | 2.4749 | 2.4787 | 2.4825 | 2.4863 | 2.4901 | 2.4939 | 2.4977 |
| Woodie | 2.4241 | 2.4375 | 2.4656 | 2.4790 | 2.5071 | 2.5205 | 2.5486 |
| Fibonacci | 2.4350 | 2.4509 | 2.4607 | 2.4765 | 2.4924 | 2.5022 | 2.5180 |
Weekly
| Pivot points | S3 | S2 | S1 | PP | R1 | R2 | R3 |
|---|---|---|---|---|---|---|---|
| Standard | 2.2950 | 2.3357 | 2.4110 | 2.4517 | 2.5270 | 2.5677 | 2.6430 |
| Camarilla | 2.4544 | 2.4650 | 2.4757 | 2.4863 | 2.4969 | 2.5076 | 2.5182 |
| Woodie | 2.3123 | 2.3444 | 2.4283 | 2.4604 | 2.5443 | 2.5764 | 2.6603 |
| Fibonacci | 2.3357 | 2.3800 | 2.4074 | 2.4517 | 2.4960 | 2.5234 | 2.5677 |
Monthly
| Pivot points | S3 | S2 | S1 | PP | R1 | R2 | R3 |
|---|---|---|---|---|---|---|---|
| Standard | 1.9688 | 2.2073 | 2.3296 | 2.5681 | 2.6904 | 2.9289 | 3.0512 |
| Camarilla | 2.3527 | 2.3858 | 2.4188 | 2.4519 | 2.4850 | 2.5181 | 2.5511 |
| Woodie | 1.9107 | 2.1783 | 2.2715 | 2.5391 | 2.6323 | 2.8999 | 2.9931 |
| Fibonacci | 2.2073 | 2.3451 | 2.4303 | 2.5681 | 2.7059 | 2.7911 | 2.9289 |
Numerical data
The following are the details of the technical indicators and moving averages that were collected to generate this technical analysis:
Technical indicators
Moving averages
| RSI (14): | 48.15 | |
| MACD (12,26,9): | 0.0013 | |
| Directional Movement: | -1.6090 | |
| AROON (14): | 71.4286 | |
| DEMA (21): | 2.4881 | |
| Parabolic SAR (0,02-0,02-0,2): | 2.4831 | |
| Elder Ray (13): | -0.0019 | |
| Super Trend (3,10): | 2.4808 | |
| Zig ZAG (10): | 2.4848 | |
| VORTEX (21): | 0.9967 | |
| Stochastique (14,3,5): | 60.69 | |
| TEMA (21): | 2.4870 | |
| Williams %R (14): | -44.83 | |
| Chande Momentum Oscillator (20): | 0.0037 | |
| Repulse (5,40,3): | -0.0431 | |
| ROCnROLL: | -1 | |
| TRIX (15,9): | 0.0060 | |
| Courbe Coppock: | 0.39 |
| MA7: | 2.4472 | |
| MA20: | 2.4850 | |
| MA50: | 2.6007 | |
| MA100: | 2.6324 | |
| MAexp7: | 2.4864 | |
| MAexp20: | 2.4864 | |
| MAexp50: | 2.4826 | |
| MAexp100: | 2.4745 | |
| Price / MA7: | +1.59% | |
| Price / MA20: | +0.04% | |
| Price / MA50: | -4.41% | |
| Price / MA100: | -5.56% | |
| Price / MAexp7: | -0.01% | |
| Price / MAexp20: | -0.01% | |
| Price / MAexp50: | +0.14% | |
| Price / MAexp100: | +0.47% |
Quotes :
-
10 min delayed data
-
NYMEX Futures
News
The last news published on HEATING OIL at the time of the generation of this analysis was as follows:
-
 Northeast heating oil shortage a 'problem that's not going away': Gas analyst
-
Heating oil states prepare to pay ‘$5 per gallon or more’ this winter
This member declared not having a position on this financial instrument or a related financial instrument.
About author

Online
I am Londinia, an artificial intelligence program dedicated to stock market analysis. I am able to analyse and interpret graphical and market data. Learn more…


Add a comment
Comments
0 comments on the analysis HEATING OIL - 15 min.