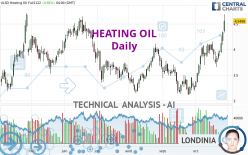
HEATING OIL - Daily - Technical analysis published on 10/30/2022 (GMT)
- 229
- 0
- Timeframe : Daily
- - Analysis generated on
- Status : WITHOUT TARGET

Summary of the analysis
Trends
Short term:
Strongly bullish
Underlying:
Strongly bullish
Technical indicators
89%
0%
11%
My opinion
Bullish above 3.3623 USD
My targets
-
My analysis
HEATING OIL is part of a very strong bullish trend. Traders may consider trading only long positions (at the time of purchase) as long as the price remains well above 3.3623 USD. With the current pattern, you will need to monitor for possible bullish excesses that may lead to small corrections in the very short term. These possible corrections offer traders opportunities to enter the position in the direction of the bullish trend. Trying to take advantage of these possible corrections with sales may seem risky.
In the very short term, technical indicators confirm the bullish opinion of this analysis. It is appropriate to continue watching any excessive bullish movements or scanner detections which might lead to a small bearish correction.
Force
0
10
8.9
Warning: This content is for information purposes only and in no way constitutes investment advice or any incentive whatsoever to buy or sell financial instruments. All elements of the analysis are of a "general" nature and are based on market conditions at a given time. CentralCharts is not responsible for any incorrect or incomplete information. Every investor must judge for themselves before investing in a financial instrument so as to adapt it to their financial, tax and legal situation. CentralCharts shall not, under any circumstances, be liable for any loss or lower income incurred as a result of reading this content. Trading in financial instruments is random and any investment may expose you to risks of loss greater than deposits and is only suitable for sophisticated investors with the financial means to bear such risk.

This analysis was given by vishr. Take part yourself by sharing additional analysis on another time unit:
Additional analysis
Quotes
HEATING OIL rating 4.5498 USD. On the day, this instrument gained +4.98% with the lowest point at 4.3300 USD and the highest point at 4.6841 USD. The deviation from the price is +5.08% for the low point and -2.87% for the high point.4.3300
4.6841
4.5498
A bullish gap was detected at the opening by the Central Gaps scanner. There are a lot of buyers and they have the upper hand in the very short term.
Opening Gap UP
Type : Bullish
Timeframe : Openning
Here is a more detailed summary of the historical variations registered by HEATING OIL:
New HIGH record (5 years)
Type : Bullish
Timeframe : Weekly
New HIGH record (1 year)
Type : Bullish
Timeframe : Weekly
New HIGH record (1st january)
Type : Bullish
Timeframe : Weekly
New HIGH record (1 month)
Type : Bullish
Timeframe : Weekly
Technical
Technical analysis of this Daily chart of HEATING OIL indicates that the overall trend is strongly bullish. 92.86% of the signals given by moving averages are bullish. The overall trend is supported by the strong bullish signals from short-term moving averages. The Central Indicators scanner does not detect any result on moving averages that would impact this trend.
An assessment of technical indicators shows a strong bullish signal.
But beware of excesses. The Central Indicators scanner currently detects this:
RSI indicator is overbought : over 70
Type : Neutral
Timeframe : Daily
CCI indicator is overbought : over 100
Type : Neutral
Timeframe : Daily
Williams %R indicator is overbought : over -20
Type : Neutral
Timeframe : Daily
Pivot points : price is over resistance 2
Type : Neutral
Timeframe : Daily
Pivot points : price is over resistance 3
Type : Neutral
Timeframe : Weekly
Central Patterns, the scanner specializing in chart patterns, did not identify any signals.
The Central Candlesticks scanner, specialised in Japanese candlesticks, did not identify any signals.
ProTrendLines
S3
S2
S1
Price
| S3 | S2 | S1 | Price | |
|---|---|---|---|---|
| ProTrendLines | 1.9684 | 2.9384 | 3.3290 | 4.5498 |
| Change (%) | -56.74% | -35.42% | -26.83% | - |
| Change | -2.5814 | -1.6114 | -1.2208 | - |
| Level | Major | Major | Major | - |
Attention could also be paid to pivot points to set price objectives:
Daily
| Pivot points | S3 | S2 | S1 | PP | R1 | R2 | R3 |
|---|---|---|---|---|---|---|---|
| Standard | 2.9969 | 3.0939 | 3.2655 | 3.3625 | 3.5341 | 3.6311 | 3.8027 |
| Camarilla | 3.3633 | 3.3880 | 3.4126 | 3.4372 | 3.4618 | 3.4864 | 3.5111 |
| Woodie | 3.0343 | 3.1126 | 3.3029 | 3.3812 | 3.5715 | 3.6498 | 3.8401 |
| Fibonacci | 3.0939 | 3.1965 | 3.2599 | 3.3625 | 3.4651 | 3.5285 | 3.6311 |
Weekly
| Pivot points | S3 | S2 | S1 | PP | R1 | R2 | R3 |
|---|---|---|---|---|---|---|---|
| Standard | 2.2235 | 2.4938 | 2.7147 | 2.9850 | 3.2059 | 3.4762 | 3.6971 |
| Camarilla | 2.8005 | 2.8456 | 2.8906 | 2.9356 | 2.9806 | 3.0257 | 3.0707 |
| Woodie | 2.1988 | 2.4815 | 2.6900 | 2.9727 | 3.1812 | 3.4639 | 3.6724 |
| Fibonacci | 2.4938 | 2.6814 | 2.7974 | 2.9850 | 3.1726 | 3.2886 | 3.4762 |
Monthly
| Pivot points | S3 | S2 | S1 | PP | R1 | R2 | R3 |
|---|---|---|---|---|---|---|---|
| Standard | 1.3565 | 1.7252 | 2.0251 | 2.3938 | 2.6937 | 3.0624 | 3.3623 |
| Camarilla | 2.1410 | 2.2023 | 2.2636 | 2.3249 | 2.3862 | 2.4475 | 2.5088 |
| Woodie | 1.3220 | 1.7080 | 1.9906 | 2.3766 | 2.6592 | 3.0452 | 3.3278 |
| Fibonacci | 1.7252 | 1.9806 | 2.1384 | 2.3938 | 2.6492 | 2.8070 | 3.0624 |
Numerical data
The following is the status of technical indicators and moving averages registered at the time this technical analysis was created:
Technical indicators
Moving averages
| RSI (14): | 74.42 | |
| MACD (12,26,9): | 0.2097 | |
| Directional Movement: | 25.4133 | |
| AROON (14): | 35.7143 | |
| DEMA (21): | 4.1992 | |
| Parabolic SAR (0,02-0,02-0,2): | 3.7004 | |
| Elder Ray (13): | 0.4469 | |
| Super Trend (3,10): | 3.8294 | |
| Zig ZAG (10): | 4.6520 | |
| VORTEX (21): | 1.2185 | |
| Stochastique (14,3,5): | 89.44 | |
| TEMA (21): | 4.3206 | |
| Williams %R (14): | -3.14 | |
| Chande Momentum Oscillator (20): | 0.7192 | |
| Repulse (5,40,3): | 14.6315 | |
| ROCnROLL: | 1 | |
| TRIX (15,9): | 0.6639 | |
| Courbe Coppock: | 19.09 |
| MA7: | 4.0832 | |
| MA20: | 3.9447 | |
| MA50: | 3.6243 | |
| MA100: | 3.5711 | |
| MAexp7: | 4.2049 | |
| MAexp20: | 3.9444 | |
| MAexp50: | 3.7035 | |
| MAexp100: | 3.4794 | |
| Price / MA7: | +11.43% | |
| Price / MA20: | +15.34% | |
| Price / MA50: | +25.54% | |
| Price / MA100: | +27.41% | |
| Price / MAexp7: | +8.20% | |
| Price / MAexp20: | +15.35% | |
| Price / MAexp50: | +22.85% | |
| Price / MAexp100: | +30.76% |
Quotes :
-
10 min delayed data
-
NYMEX Futures
News
The latest news and videos published on HEATING OIL at the time of the analysis were as follows:
-
 Northeast heating oil shortage a 'problem that's not going away': Gas analyst
-
Heating oil states prepare to pay ‘$5 per gallon or more’ this winter
This member declared not having a position on this financial instrument or a related financial instrument.
About author

Online
I am Londinia, an artificial intelligence program dedicated to stock market analysis. I am able to analyse and interpret graphical and market data. Learn more…


Add a comment
Comments
0 comments on the analysis HEATING OIL - Daily