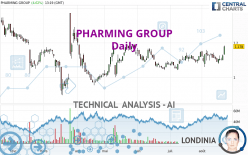
PHARMING GROUP - Daily - Technical analysis published on 08/22/2023 (GMT)
- 163
- 0
Click here for a new analysis!
- Timeframe : Daily
- - Analysis generated on
- Status : INVALID

Summary of the analysis

Additional analysis
Quotes
The PHARMING GROUP price is 1.178 EUR. On the day, this instrument gained +4.62% with the lowest point at 1.131 EUR and the highest point at 1.185 EUR. The deviation from the price is +4.16% for the low point and -0.59% for the high point.A bullish opening was detected by the Central Gaps scanner. Buyers are trying to impose a bullish momentum in the very short term.
Bullish opening
Type : Bullish
Timeframe : Openning
Here is a more detailed summary of the historical variations registered by PHARMING GROUP:
New HIGH record (1 month)
Type : Bullish
Timeframe : Weekly
Technical
Technical analysis of PHARMING GROUP in Daily shows a strongly overall bullish trend. The signals given by the moving averages are 82.14% bullish. This strong bullish trend is confirmed by the strong signals currently being given by short-term moving averages. The Central Indicators market scanner is currently detecting several bullish signals that could impact this trend:
Bullish trend reversal : Moving Average 20
Type : Bullish
Timeframe : Daily
Bullish trend reversal : adaptative moving average 20
Type : Bullish
Timeframe : Daily
In fact, 14 technical indicators on 18 studied are currently bullish. But beware of excesses. The Central Indicators scanner currently detects this:
CCI indicator is overbought : over 100
Type : Neutral
Timeframe : Daily
Williams %R indicator is overbought : over -20
Type : Neutral
Timeframe : Daily
Pivot points : price is over resistance 3
Type : Neutral
Timeframe : Daily
Pivot points : price is over resistance 3
Type : Neutral
Timeframe : Weekly
MACD crosses UP its Moving Average
Type : Bullish
Timeframe : Daily
Momentum indicator is back over 0
Type : Bullish
Timeframe : Daily
The Central Patterns scanner, which studies chart patterns, resistances and supports, has identified these signals:
Near horizontal resistance
Type : Bearish
Timeframe : Daily
Resistance of channel is broken
Type : Bullish
Timeframe : Daily
Resistance of triangle is broken
Type : Bullish
Timeframe : Daily
The Central Candlesticks scanner, specialised in Japanese candlesticks, did not identify any signals.
| S3 | S2 | S1 | Price | R1 | R2 | R3 | |
|---|---|---|---|---|---|---|---|
| ProTrendLines | 1.049 | 1.091 | 1.160 | 1.178 | 1.262 | 1.310 | 1.377 |
| Change (%) | -10.93% | -7.43% | -1.51% | - | +7.13% | +11.21% | +16.89% |
| Change | -0.129 | -0.088 | -0.018 | - | +0.084 | +0.132 | +0.199 |
| Level | Major | Major | Major | - | Intermediate | Minor | Major |
To determine price objectives, it is also possible to use the pivot points. Here is the price position in relation to pivot points:
| Pivot points | S3 | S2 | S1 | PP | R1 | R2 | R3 |
|---|---|---|---|---|---|---|---|
| Standard | 1.075 | 1.087 | 1.107 | 1.119 | 1.139 | 1.151 | 1.171 |
| Camarilla | 1.117 | 1.120 | 1.123 | 1.126 | 1.129 | 1.132 | 1.135 |
| Woodie | 1.078 | 1.089 | 1.110 | 1.121 | 1.142 | 1.153 | 1.174 |
| Fibonacci | 1.087 | 1.100 | 1.107 | 1.119 | 1.132 | 1.139 | 1.151 |
| Pivot points | S3 | S2 | S1 | PP | R1 | R2 | R3 |
|---|---|---|---|---|---|---|---|
| Standard | 1.031 | 1.054 | 1.079 | 1.102 | 1.127 | 1.150 | 1.175 |
| Camarilla | 1.090 | 1.094 | 1.099 | 1.103 | 1.107 | 1.112 | 1.116 |
| Woodie | 1.031 | 1.055 | 1.079 | 1.103 | 1.127 | 1.151 | 1.175 |
| Fibonacci | 1.054 | 1.073 | 1.084 | 1.102 | 1.121 | 1.132 | 1.150 |
| Pivot points | S3 | S2 | S1 | PP | R1 | R2 | R3 |
|---|---|---|---|---|---|---|---|
| Standard | 0.966 | 1.004 | 1.075 | 1.113 | 1.184 | 1.222 | 1.293 |
| Camarilla | 1.117 | 1.127 | 1.137 | 1.147 | 1.157 | 1.167 | 1.177 |
| Woodie | 0.984 | 1.012 | 1.093 | 1.121 | 1.202 | 1.230 | 1.311 |
| Fibonacci | 1.004 | 1.045 | 1.071 | 1.113 | 1.154 | 1.180 | 1.222 |
Numerical data
The following is the status of the technical indicators and moving averages at the time of publication of this technical analysis:
| RSI (14): | 65.29 | |
| MACD (12,26,9): | 0.0070 | |
| Directional Movement: | 12.835 | |
| AROON (14): | 92.857 | |
| DEMA (21): | 1.126 | |
| Parabolic SAR (0,02-0,02-0,2): | 1.079 | |
| Elder Ray (13): | 0.037 | |
| Super Trend (3,10): | 1.064 | |
| Zig ZAG (10): | 1.175 | |
| VORTEX (21): | 1.0330 | |
| Stochastique (14,3,5): | 67.69 | |
| TEMA (21): | 1.129 | |
| Williams %R (14): | -7.94 | |
| Chande Momentum Oscillator (20): | 0.041 | |
| Repulse (5,40,3): | 5.8840 | |
| ROCnROLL: | 1 | |
| TRIX (15,9): | 0.0580 | |
| Courbe Coppock: | 0.67 |
| MA7: | 1.117 | |
| MA20: | 1.118 | |
| MA50: | 1.100 | |
| MA100: | 1.096 | |
| MAexp7: | 1.128 | |
| MAexp20: | 1.118 | |
| MAexp50: | 1.110 | |
| MAexp100: | 1.108 | |
| Price / MA7: | +5.46% | |
| Price / MA20: | +5.37% | |
| Price / MA50: | +7.09% | |
| Price / MA100: | +7.48% | |
| Price / MAexp7: | +4.43% | |
| Price / MAexp20: | +5.37% | |
| Price / MAexp50: | +6.13% | |
| Price / MAexp100: | +6.32% |
News
The latest news and videos published on PHARMING GROUP at the time of the analysis were as follows:
- Notice of First Quarter 2023 Results
- Pharming announces US FDA approval of Joenja® (leniolisib) as the first and only treatment indicated for APDS
- Pharming announces US FDA approval of Joenja® (leniolisib) as the first and only treatment indicated for APDS
- Pharming announces US FDA approval of Joenja® (leniolisib) as the first and only treatment indicated for APDS
- Pharming Group reports financial results for full year 2022
About author
Online


Add a comment
Comments
0 comments on the analysis PHARMING GROUP - Daily