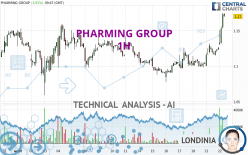
PHARMING GROUP - 1H - Technical analysis published on 08/22/2023 (GMT)
- 165
- 0
Click here for a new analysis!
- Timeframe : 1H
- - Analysis generated on
- Status : TARGET REACHED

Summary of the analysis

Additional analysis
Quotes
PHARMING GROUP rating 1.168 EUR. The price has increased by +3.73% since the last closing with the lowest point at 1.131 EUR and the highest point at 1.168 EUR. The deviation from the price is +3.27% for the low point and 0% for the high point.The Central Gaps scanner detects a bullish opening. A small advantage for buyers in the very short term.
Bullish opening
Type : Bullish
Timeframe : Openning
Here is a more detailed summary of the historical variations registered by PHARMING GROUP:
New HIGH record (1 month)
Type : Bullish
Timeframe : Weekly
Technical
Technical analysis of PHARMING GROUP in 1H shows a strongly overall bullish trend. 85.71% of the signals given by moving averages are bullish. This strongly bullish trend is supported by the strong bullish signals given by short-term moving averages. The Central Indicators market scanner is currently detecting a bullish signal that could impact this trend:
Bullish trend reversal : Moving Average 100
Type : Bullish
Timeframe : 1 hour
An assessment of technical indicators shows a strong bullish signal.
But beware of excesses. The Central Indicators scanner currently detects this:
RSI indicator is overbought : over 70
Type : Neutral
Timeframe : 1 hour
CCI indicator is overbought : over 100
Type : Neutral
Timeframe : 1 hour
Previous candle closed over Bollinger bands
Type : Neutral
Timeframe : 1 hour
Williams %R indicator is overbought : over -20
Type : Neutral
Timeframe : 1 hour
Pivot points : price is over resistance 2
Type : Neutral
Timeframe : 1 hour
Pivot points : price is over resistance 2
Type : Neutral
Timeframe : Weekly
An analysis of the price chart with the Central Patterns scanner (detector of chart patterns and resistances and supports) shows several results that can have an impact on the price change:
Near horizontal resistance
Type : Bearish
Timeframe : 1 hour
Resistance of channel is broken
Type : Bullish
Timeframe : 1 hour
The Central Candlesticks scanner which studies Japanese candlesticks did not detect anything.
| S3 | S2 | S1 | Price | R1 | R2 | R3 | |
|---|---|---|---|---|---|---|---|
| ProTrendLines | 1.129 | 1.142 | 1.160 | 1.168 | 1.262 | 1.310 | 1.377 |
| Change (%) | -3.34% | -2.25% | -0.67% | - | +8.05% | +12.16% | +17.89% |
| Change | -0.039 | -0.026 | -0.008 | - | +0.094 | +0.142 | +0.209 |
| Level | Minor | Intermediate | Major | - | Intermediate | Minor | Major |
Attention could also be paid to pivot points to set price objectives:
| Pivot points | S3 | S2 | S1 | PP | R1 | R2 | R3 |
|---|---|---|---|---|---|---|---|
| Standard | 1.075 | 1.087 | 1.107 | 1.119 | 1.139 | 1.151 | 1.171 |
| Camarilla | 1.117 | 1.120 | 1.123 | 1.126 | 1.129 | 1.132 | 1.135 |
| Woodie | 1.078 | 1.089 | 1.110 | 1.121 | 1.142 | 1.153 | 1.174 |
| Fibonacci | 1.087 | 1.100 | 1.107 | 1.119 | 1.132 | 1.139 | 1.151 |
| Pivot points | S3 | S2 | S1 | PP | R1 | R2 | R3 |
|---|---|---|---|---|---|---|---|
| Standard | 1.031 | 1.054 | 1.079 | 1.102 | 1.127 | 1.150 | 1.175 |
| Camarilla | 1.090 | 1.094 | 1.099 | 1.103 | 1.107 | 1.112 | 1.116 |
| Woodie | 1.031 | 1.055 | 1.079 | 1.103 | 1.127 | 1.151 | 1.175 |
| Fibonacci | 1.054 | 1.073 | 1.084 | 1.102 | 1.121 | 1.132 | 1.150 |
| Pivot points | S3 | S2 | S1 | PP | R1 | R2 | R3 |
|---|---|---|---|---|---|---|---|
| Standard | 0.966 | 1.004 | 1.075 | 1.113 | 1.184 | 1.222 | 1.293 |
| Camarilla | 1.117 | 1.127 | 1.137 | 1.147 | 1.157 | 1.167 | 1.177 |
| Woodie | 0.984 | 1.012 | 1.093 | 1.121 | 1.202 | 1.230 | 1.311 |
| Fibonacci | 1.004 | 1.045 | 1.071 | 1.113 | 1.154 | 1.180 | 1.222 |
Numerical data
The following is the status of technical indicators and moving averages registered at the time this technical analysis was created:
| RSI (14): | 78.20 | |
| MACD (12,26,9): | 0.0100 | |
| Directional Movement: | 31.654 | |
| AROON (14): | 92.857 | |
| DEMA (21): | 1.135 | |
| Parabolic SAR (0,02-0,02-0,2): | 1.118 | |
| Elder Ray (13): | 0.028 | |
| Super Trend (3,10): | 1.127 | |
| Zig ZAG (10): | 1.162 | |
| VORTEX (21): | 1.2360 | |
| Stochastique (14,3,5): | 86.96 | |
| TEMA (21): | 1.144 | |
| Williams %R (14): | 0.00 | |
| Chande Momentum Oscillator (20): | 0.061 | |
| Repulse (5,40,3): | 2.4350 | |
| ROCnROLL: | 1 | |
| TRIX (15,9): | 0.0770 | |
| Courbe Coppock: | 5.81 |
| MA7: | 1.115 | |
| MA20: | 1.118 | |
| MA50: | 1.100 | |
| MA100: | 1.096 | |
| MAexp7: | 1.139 | |
| MAexp20: | 1.124 | |
| MAexp50: | 1.115 | |
| MAexp100: | 1.115 | |
| Price / MA7: | +4.75% | |
| Price / MA20: | +4.47% | |
| Price / MA50: | +6.18% | |
| Price / MA100: | +6.57% | |
| Price / MAexp7: | +2.55% | |
| Price / MAexp20: | +3.91% | |
| Price / MAexp50: | +4.75% | |
| Price / MAexp100: | +4.75% |
News
The last news published on PHARMING GROUP at the time of the generation of this analysis was as follows:
- Notice of First Quarter 2023 Results
- Pharming announces US FDA approval of Joenja® (leniolisib) as the first and only treatment indicated for APDS
- Pharming announces US FDA approval of Joenja® (leniolisib) as the first and only treatment indicated for APDS
- Pharming announces US FDA approval of Joenja® (leniolisib) as the first and only treatment indicated for APDS
- Pharming Group reports financial results for full year 2022
About author
Online


Add a comment
Comments
0 comments on the analysis PHARMING GROUP - 1H