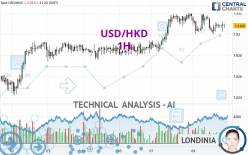
USD/HKD - 1H - Technical analysis published on 04/09/2024 (GMT)
- 114
- 0
Click here for a new analysis!
- Timeframe : 1H
- - Analysis generated on
- Status : LEVEL MAINTAINED

Summary of the analysis

Additional analysis
Quotes
The USD/HKD rating is 7.8308 HKD. The price is lower by -0.01% since the last closing and was traded between 7.8300 HKD and 7.8319 HKD over the period. The price is currently at +0.01% from its lowest and -0.01% from its highest.A bearish opening was detected by the Central Gaps scanner. Sellers are trying to impose a bearish trend in the very short term.
Bearish opening
Type : Bearish
Timeframe : Openning
So that you have an overall view of the price change, here is a table showing the variations over several periods:
Near a new LOW record (5 years)
Type : Bearish
Timeframe : Weekly
Near a new HIGH record (1 year)
Type : Bullish
Timeframe : Weekly
Near a new HIGH record (1st january)
Type : Bullish
Timeframe : Weekly
Near a new HIGH record (1 month)
Type : Bullish
Timeframe : Weekly
Technical
A technical analysis in 1H of this USD/HKD chart shows a bullish trend. 75.00% of the signals given by moving averages are bullish. Caution: the neutral signals currently given by short-term moving averages show us that the global trend is losing momentum. The Central Indicators scanner detects bullish and bearish signals on moving averages that could impact this trend:
Bullish trend reversal : adaptative moving average 20
Type : Bullish
Timeframe : 1 hour
Bearish price crossover with Moving Average 20
Type : Bearish
Timeframe : 1 hour
An assessment of technical indicators does not currently provide any relevant information on the direction of future price movements.
Other results related to technical indicators were also found by the Central Indicators scanner:
Pivot points : price is over resistance 1
Type : Neutral
Timeframe : Weekly
RSI indicator is back under 50
Type : Bearish
Timeframe : 1 hour
An analysis of the price chart with the Central Patterns scanner (detector of chart patterns and resistances and supports) shows several results that can have an impact on the price change:
Near horizontal support
Type : Bullish
Timeframe : 1 hour
Support of channel is broken
Type : Bearish
Timeframe : 1 hour
No result was found by the Central Candlesticks scanner on Japanese candlesticks.
| S3 | S2 | S1 | Price | R1 | R2 | R3 | |
|---|---|---|---|---|---|---|---|
| ProTrendLines | 7.8263 | 7.8293 | 7.8307 | 7.8308 | 7.8319 | 7.8376 | 7.8500 |
| Change (%) | -0.06% | -0.02% | +0.00% | - | +0.01% | +0.09% | +0.25% |
| Change | -0.0045 | -0.0015 | -0.0001 | - | +0.0011 | +0.0068 | +0.0192 |
| Level | Major | Major | Minor | - | Intermediate | Minor | Major |
To determine price objectives, it is also possible to use the pivot points. Here is the price position in relation to pivot points:
| Pivot points | S3 | S2 | S1 | PP | R1 | R2 | R3 |
|---|---|---|---|---|---|---|---|
| Standard | 7.8256 | 7.8270 | 7.8293 | 7.8307 | 7.8330 | 7.8344 | 7.8367 |
| Camarilla | 7.8307 | 7.8310 | 7.8314 | 7.8317 | 7.8320 | 7.8324 | 7.8327 |
| Woodie | 7.8262 | 7.8272 | 7.8299 | 7.8309 | 7.8336 | 7.8346 | 7.8373 |
| Fibonacci | 7.8270 | 7.8284 | 7.8293 | 7.8307 | 7.8321 | 7.8330 | 7.8344 |
| Pivot points | S3 | S2 | S1 | PP | R1 | R2 | R3 |
|---|---|---|---|---|---|---|---|
| Standard | 7.8201 | 7.8221 | 7.8255 | 7.8275 | 7.8309 | 7.8329 | 7.8363 |
| Camarilla | 7.8275 | 7.8280 | 7.8285 | 7.8290 | 7.8295 | 7.8300 | 7.8305 |
| Woodie | 7.8209 | 7.8225 | 7.8263 | 7.8279 | 7.8317 | 7.8333 | 7.8371 |
| Fibonacci | 7.8221 | 7.8241 | 7.8254 | 7.8275 | 7.8295 | 7.8308 | 7.8329 |
| Pivot points | S3 | S2 | S1 | PP | R1 | R2 | R3 |
|---|---|---|---|---|---|---|---|
| Standard | 7.8048 | 7.8109 | 7.8175 | 7.8236 | 7.8302 | 7.8363 | 7.8429 |
| Camarilla | 7.8205 | 7.8217 | 7.8228 | 7.8240 | 7.8252 | 7.8263 | 7.8275 |
| Woodie | 7.8050 | 7.8110 | 7.8177 | 7.8237 | 7.8304 | 7.8364 | 7.8431 |
| Fibonacci | 7.8109 | 7.8158 | 7.8188 | 7.8236 | 7.8285 | 7.8315 | 7.8363 |
Numerical data
The following is the status of technical indicators and moving averages registered at the time this technical analysis was created:
| RSI (14): | 50.87 | |
| MACD (12,26,9): | 0.0000 | |
| Directional Movement: | -3.8936 | |
| AROON (14): | -50.0000 | |
| DEMA (21): | 7.8309 | |
| Parabolic SAR (0,02-0,02-0,2): | 7.8314 | |
| Elder Ray (13): | 0 | |
| Super Trend (3,10): | 7.8296 | |
| Zig ZAG (10): | 7.8307 | |
| VORTEX (21): | 0.9853 | |
| Stochastique (14,3,5): | 48.34 | |
| TEMA (21): | 7.8307 | |
| Williams %R (14): | -55.56 | |
| Chande Momentum Oscillator (20): | -0.0008 | |
| Repulse (5,40,3): | 0.0035 | |
| ROCnROLL: | -1 | |
| TRIX (15,9): | 0.0000 | |
| Courbe Coppock: | 0.01 |
| MA7: | 7.8289 | |
| MA20: | 7.8248 | |
| MA50: | 7.8232 | |
| MA100: | 7.8167 | |
| MAexp7: | 7.8309 | |
| MAexp20: | 7.8309 | |
| MAexp50: | 7.8306 | |
| MAexp100: | 7.8297 | |
| Price / MA7: | +0.02% | |
| Price / MA20: | +0.08% | |
| Price / MA50: | +0.10% | |
| Price / MA100: | +0.18% | |
| Price / MAexp7: | +0.00% | |
| Price / MAexp20: | +0.00% | |
| Price / MAexp50: | +0.00% | |
| Price / MAexp100: | +0.01% |
About author
Online


Add a comment
Comments
0 comments on the analysis USD/HKD - 1H