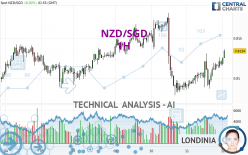
NZD/SGD - 1H - Technical analysis published on 04/12/2024 (GMT)
- 102
- 0
Click here for a new analysis!
- Timeframe : 1H
- - Analysis generated on
- Status : INVALID

Summary of the analysis

Additional analysis
Quotes
The NZD/SGD rating is 0.8134 SGD. The price has increased by +0.20% since the last closing with the lowest point at 0.8116 SGD and the highest point at 0.8136 SGD. The deviation from the price is +0.22% for the low point and -0.02% for the high point.A study of price movements over other periods shows the following variations:
Near a new LOW record (5 years)
Type : Bearish
Timeframe : Weekly
Near a new HIGH record (1 year)
Type : Bullish
Timeframe : Weekly
Near a new HIGH record (1st january)
Type : Bullish
Timeframe : Weekly
Near a new HIGH record (1 month)
Type : Bullish
Timeframe : Weekly
Technical
A technical analysis in 1H of this NZD/SGD chart shows a bullish trend. 64.29% of the signals given by moving averages are bullish. This bullish trend is supported by the strong bullish signals given by short-term moving averages. The Central Indicators scanner detects bullish signals on moving averages that could impact this trend:
Bullish price crossover with Moving Average 100
Type : Bullish
Timeframe : 1 hour
Bullish price crossover with adaptative moving average 100
Type : Bullish
Timeframe : 1 hour
An assessment of technical indicators shows a strong bullish signal.
But beware of excesses. The Central Indicators scanner currently detects this:
CCI indicator is overbought : over 100
Type : Neutral
Timeframe : 1 hour
Williams %R indicator is overbought : over -20
Type : Neutral
Timeframe : 1 hour
Aroon indicator bullish trend
Type : Bullish
Timeframe : 1 hour
Ichimoku : price is over the cloud
Type : Bullish
Timeframe : 1 hour
No signals are given by Central Patterns, a market scanner specialised in chart patterns, resistances and supports.
The Central Candlesticks scanner which studies Japanese candlesticks did not detect anything.
| S3 | S2 | S1 | Price | R1 | R2 | R3 | |
|---|---|---|---|---|---|---|---|
| ProTrendLines | 0.8103 | 0.8116 | 0.8131 | 0.8134 | 0.8143 | 0.8167 | 0.8181 |
| Change (%) | -0.38% | -0.22% | -0.04% | - | +0.11% | +0.41% | +0.58% |
| Change | -0.0031 | -0.0018 | -0.0003 | - | +0.0009 | +0.0033 | +0.0047 |
| Level | Minor | Minor | Intermediate | - | Major | Minor | Intermediate |
To determine price objectives, it is also possible to use the pivot points. Here is the price position in relation to pivot points:
| Pivot points | S3 | S2 | S1 | PP | R1 | R2 | R3 |
|---|---|---|---|---|---|---|---|
| Standard | 0.8047 | 0.8067 | 0.8092 | 0.8112 | 0.8137 | 0.8157 | 0.8182 |
| Camarilla | 0.8106 | 0.8110 | 0.8114 | 0.8118 | 0.8122 | 0.8126 | 0.8130 |
| Woodie | 0.8051 | 0.8068 | 0.8096 | 0.8113 | 0.8141 | 0.8158 | 0.8186 |
| Fibonacci | 0.8067 | 0.8084 | 0.8095 | 0.8112 | 0.8129 | 0.8140 | 0.8157 |
| Pivot points | S3 | S2 | S1 | PP | R1 | R2 | R3 |
|---|---|---|---|---|---|---|---|
| Standard | 0.7946 | 0.7992 | 0.8050 | 0.8096 | 0.8154 | 0.8200 | 0.8258 |
| Camarilla | 0.8079 | 0.8089 | 0.8099 | 0.8108 | 0.8118 | 0.8127 | 0.8137 |
| Woodie | 0.7952 | 0.7995 | 0.8056 | 0.8099 | 0.8160 | 0.8203 | 0.8264 |
| Fibonacci | 0.7992 | 0.8032 | 0.8056 | 0.8096 | 0.8136 | 0.8160 | 0.8200 |
| Pivot points | S3 | S2 | S1 | PP | R1 | R2 | R3 |
|---|---|---|---|---|---|---|---|
| Standard | 0.7778 | 0.7912 | 0.7991 | 0.8125 | 0.8204 | 0.8338 | 0.8417 |
| Camarilla | 0.8010 | 0.8030 | 0.8050 | 0.8069 | 0.8089 | 0.8108 | 0.8128 |
| Woodie | 0.7750 | 0.7898 | 0.7963 | 0.8111 | 0.8176 | 0.8324 | 0.8389 |
| Fibonacci | 0.7912 | 0.7994 | 0.8044 | 0.8125 | 0.8207 | 0.8257 | 0.8338 |
Numerical data
The following is the status of technical indicators and moving averages registered at the time this technical analysis was created:
| RSI (14): | 64.51 | |
| MACD (12,26,9): | 0.0004 | |
| Directional Movement: | 16.4729 | |
| AROON (14): | 71.4286 | |
| DEMA (21): | 0.8117 | |
| Parabolic SAR (0,02-0,02-0,2): | 0.8089 | |
| Elder Ray (13): | 0.0014 | |
| Super Trend (3,10): | 0.8098 | |
| Zig ZAG (10): | 0.8134 | |
| VORTEX (21): | 1.1350 | |
| Stochastique (14,3,5): | 83.57 | |
| TEMA (21): | 0.8124 | |
| Williams %R (14): | -6.12 | |
| Chande Momentum Oscillator (20): | 0.0021 | |
| Repulse (5,40,3): | 0.1676 | |
| ROCnROLL: | 1 | |
| TRIX (15,9): | 0.0006 | |
| Courbe Coppock: | 0.40 |
| MA7: | 0.8123 | |
| MA20: | 0.8104 | |
| MA50: | 0.8178 | |
| MA100: | 0.8214 | |
| MAexp7: | 0.8122 | |
| MAexp20: | 0.8114 | |
| MAexp50: | 0.8116 | |
| MAexp100: | 0.8118 | |
| Price / MA7: | +0.14% | |
| Price / MA20: | +0.37% | |
| Price / MA50: | -0.54% | |
| Price / MA100: | -0.97% | |
| Price / MAexp7: | +0.15% | |
| Price / MAexp20: | +0.25% | |
| Price / MAexp50: | +0.22% | |
| Price / MAexp100: | +0.20% |
About author
Online


Add a comment
Comments
0 comments on the analysis NZD/SGD - 1H