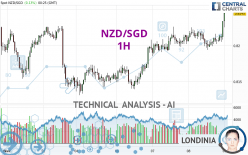
NZD/SGD - 1H - Technical analysis published on 02/09/2024 (GMT)
- 103
- 0
Click here for a new analysis!
- Timeframe : 1H
- - Analysis generated on
- Status : TARGET REACHED

Summary of the analysis

Additional analysis
Quotes
The NZD/SGD price is 0.8244 SGD. The price has increased by +0.12% since the last closing with the lowest point at 0.8225 SGD and the highest point at 0.8245 SGD. The deviation from the price is +0.23% for the low point and -0.01% for the high point.A study of price movements over other periods shows the following variations:
Near a new LOW record (5 years)
Type : Bearish
Timeframe : Weekly
Near a new LOW record (1 year)
Type : Bearish
Timeframe : Weekly
Near a new HIGH record (1st january)
Type : Bullish
Timeframe : Weekly
Near a new HIGH record (1 month)
Type : Bullish
Timeframe : Weekly
Technical
Technical analysis of this 1H chart of NZD/SGD indicates that the overall trend is strongly bullish. 92.86% of the signals given by moving averages are bullish. The overall trend is supported by the strong bullish signals from short-term moving averages. The Central Indicators market scanner is currently detecting a bullish signal that could impact this trend:
Bullish trend reversal : Moving Average 20
Type : Bullish
Timeframe : 1 hour
In fact, according to the parameters integrated into the Central Analyzer system, 17 technical indicators out of 18 analysed are currently bullish. But beware of excesses. The Central Indicators scanner currently detects this:
RSI indicator is overbought : over 70
Type : Neutral
Timeframe : 1 hour
CCI indicator is overbought : over 100
Type : Neutral
Timeframe : 1 hour
Previous candle closed over Bollinger bands
Type : Neutral
Timeframe : 1 hour
Williams %R indicator is overbought : over -20
Type : Neutral
Timeframe : 1 hour
Pivot points : price is over resistance 1
Type : Neutral
Timeframe : Weekly
Central Patterns, the market scanner focusing on chart patterns, resistances and supports found these results:
Near resistance of channel
Type : Bearish
Timeframe : 1 hour
Near support of triangle
Type : Bullish
Timeframe : 1 hour
The Central Candlesticks scanner which studies Japanese candlesticks did not detect anything.
| S3 | S2 | S1 | Price | R1 | R2 | R3 | |
|---|---|---|---|---|---|---|---|
| ProTrendLines | 0.8208 | 0.8226 | 0.8235 | 0.8244 | 0.8251 | 0.8281 | 0.8377 |
| Change (%) | -0.44% | -0.22% | -0.11% | - | +0.08% | +0.45% | +1.61% |
| Change | -0.0036 | -0.0018 | -0.0009 | - | +0.0007 | +0.0037 | +0.0133 |
| Level | Minor | Major | Minor | - | Minor | Minor | Major |
Attention could also be paid to pivot points to set price objectives:
| Pivot points | S3 | S2 | S1 | PP | R1 | R2 | R3 |
|---|---|---|---|---|---|---|---|
| Standard | 0.8167 | 0.8181 | 0.8207 | 0.8221 | 0.8247 | 0.8261 | 0.8287 |
| Camarilla | 0.8223 | 0.8227 | 0.8230 | 0.8234 | 0.8238 | 0.8241 | 0.8245 |
| Woodie | 0.8174 | 0.8184 | 0.8214 | 0.8224 | 0.8254 | 0.8264 | 0.8294 |
| Fibonacci | 0.8181 | 0.8196 | 0.8205 | 0.8221 | 0.8236 | 0.8245 | 0.8261 |
| Pivot points | S3 | S2 | S1 | PP | R1 | R2 | R3 |
|---|---|---|---|---|---|---|---|
| Standard | 0.7995 | 0.8067 | 0.8106 | 0.8178 | 0.8217 | 0.8289 | 0.8328 |
| Camarilla | 0.8114 | 0.8124 | 0.8134 | 0.8144 | 0.8154 | 0.8164 | 0.8175 |
| Woodie | 0.7978 | 0.8059 | 0.8089 | 0.8170 | 0.8200 | 0.8281 | 0.8311 |
| Fibonacci | 0.8067 | 0.8110 | 0.8136 | 0.8178 | 0.8221 | 0.8247 | 0.8289 |
| Pivot points | S3 | S2 | S1 | PP | R1 | R2 | R3 |
|---|---|---|---|---|---|---|---|
| Standard | 0.7885 | 0.8011 | 0.8103 | 0.8229 | 0.8321 | 0.8447 | 0.8539 |
| Camarilla | 0.8134 | 0.8154 | 0.8174 | 0.8194 | 0.8214 | 0.8234 | 0.8254 |
| Woodie | 0.7867 | 0.8003 | 0.8085 | 0.8221 | 0.8303 | 0.8439 | 0.8521 |
| Fibonacci | 0.8011 | 0.8095 | 0.8146 | 0.8229 | 0.8313 | 0.8364 | 0.8447 |
Numerical data
The following are the details of the technical indicators and moving averages that were collected to generate this technical analysis:
| RSI (14): | 74.32 | |
| MACD (12,26,9): | 0.0005 | |
| Directional Movement: | 19.5543 | |
| AROON (14): | 78.5714 | |
| DEMA (21): | 0.8219 | |
| Parabolic SAR (0,02-0,02-0,2): | 0.8198 | |
| Elder Ray (13): | 0.0017 | |
| Super Trend (3,10): | 0.8199 | |
| Zig ZAG (10): | 0.8238 | |
| VORTEX (21): | 1.0365 | |
| Stochastique (14,3,5): | 91.03 | |
| TEMA (21): | 0.8220 | |
| Williams %R (14): | -4.26 | |
| Chande Momentum Oscillator (20): | 0.0039 | |
| Repulse (5,40,3): | 0.5065 | |
| ROCnROLL: | 1 | |
| TRIX (15,9): | 0.0035 | |
| Courbe Coppock: | 0.21 |
| MA7: | 0.8199 | |
| MA20: | 0.8201 | |
| MA50: | 0.8255 | |
| MA100: | 0.8170 | |
| MAexp7: | 0.8222 | |
| MAexp20: | 0.8213 | |
| MAexp50: | 0.8204 | |
| MAexp100: | 0.8196 | |
| Price / MA7: | +0.55% | |
| Price / MA20: | +0.52% | |
| Price / MA50: | -0.13% | |
| Price / MA100: | +0.91% | |
| Price / MAexp7: | +0.28% | |
| Price / MAexp20: | +0.39% | |
| Price / MAexp50: | +0.50% | |
| Price / MAexp100: | +0.60% |
About author
Online


Add a comment
Comments
0 comments on the analysis NZD/SGD - 1H