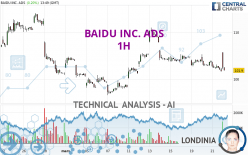
BAIDU INC. ADS - 1H - Technical analysis published on 03/22/2024 (GMT)
- 87
- 0
Click here for a new analysis!
- Timeframe : 1H
- - Analysis generated on
- Status : INVALID

Summary of the analysis

Additional analysis
Quotes
The BAIDU INC. ADS price is 102.86 USD. The price registered an increase of +1.14% on the session and was traded between 102.13 USD and 105.70 USD over the period. The price is currently at +0.71% from its lowest and -2.69% from its highest.A bullish gap was detected at the opening by the Central Gaps scanner. There are a lot of buyers and they have the upper hand in the very short term.
Opening Gap UP
Type : Bullish
Timeframe : Openning
Here is a more detailed summary of the historical variations registered by BAIDU INC. ADS:
Near a new LOW record (1 year)
Type : Bearish
Timeframe : Weekly
Near a new LOW record (1st january)
Type : Bearish
Timeframe : Weekly
Near a new LOW record (1 month)
Type : Bearish
Timeframe : Weekly
Technical
A technical analysis in 1H of this BAIDU INC. ADS chart shows a bearish trend. 78.57% of the signals given by moving averages are bearish. This bearish trend is slowing down slightly given the slightly bearish signals given by short-term moving averages. There is no crossing of moving average by the price or crossing of moving averages between themselves.
An assessment of technical indicators does not currently provide any relevant information to suggest whether the signal given by the technical indicators is more bullish or bearish.
But beware of excesses. The Central Indicators scanner currently detects this:
CCI indicator is overbought : over 100
Type : Neutral
Timeframe : 1 hour
Previous candle closed under Bollinger bands
Type : Neutral
Timeframe : 1 hour
RSI indicator is back over 50
Type : Bullish
Timeframe : 1 hour
MACD crosses UP its Moving Average
Type : Bullish
Timeframe : 1 hour
Parabolic SAR indicator bullish reversal
Type : Bullish
Timeframe : 1 hour
Aroon indicator bullish trend
Type : Bullish
Timeframe : 1 hour
An analysis of the price chart with the Central Patterns scanner (detector of chart patterns and resistances and supports) shows several results that can have an impact on the price change:
Near horizontal resistance
Type : Bearish
Timeframe : 1 hour
Near support of channel
Type : Bullish
Timeframe : 1 hour
The presence of a bearish pattern in Japanese candlesticks detected by Central Candlesticks that could cause a correction in the very short term was also detected:
Long black line
Type : Bearish
Timeframe : 1 hour
| S3 | S2 | S1 | Price | R1 | R2 | R3 | |
|---|---|---|---|---|---|---|---|
| ProTrendLines | 98.12 | 99.72 | 102.69 | 102.86 | 105.34 | 111.02 | 114.11 |
| Change (%) | -4.61% | -3.05% | -0.17% | - | +2.41% | +7.93% | +10.94% |
| Change | -4.74 | -3.14 | -0.17 | - | +2.48 | +8.16 | +11.25 |
| Level | Minor | Major | Minor | - | Major | Minor | Minor |
Pivot points can also be used to set your price objectives. Here is the price situation in relation to pivot points:
| Pivot points | S3 | S2 | S1 | PP | R1 | R2 | R3 |
|---|---|---|---|---|---|---|---|
| Standard | 98.95 | 100.30 | 101.00 | 102.35 | 103.05 | 104.40 | 105.10 |
| Camarilla | 101.14 | 101.32 | 101.51 | 101.70 | 101.89 | 102.08 | 102.26 |
| Woodie | 98.63 | 100.14 | 100.68 | 102.19 | 102.73 | 104.24 | 104.78 |
| Fibonacci | 100.30 | 101.08 | 101.57 | 102.35 | 103.13 | 103.62 | 104.40 |
| Pivot points | S3 | S2 | S1 | PP | R1 | R2 | R3 |
|---|---|---|---|---|---|---|---|
| Standard | 88.00 | 94.03 | 98.95 | 104.98 | 109.90 | 115.93 | 120.85 |
| Camarilla | 100.85 | 101.85 | 102.86 | 103.86 | 104.86 | 105.87 | 106.87 |
| Woodie | 87.44 | 93.75 | 98.39 | 104.70 | 109.34 | 115.65 | 120.29 |
| Fibonacci | 94.03 | 98.22 | 100.80 | 104.98 | 109.17 | 111.75 | 115.93 |
| Pivot points | S3 | S2 | S1 | PP | R1 | R2 | R3 |
|---|---|---|---|---|---|---|---|
| Standard | 83.49 | 92.17 | 96.75 | 105.43 | 110.01 | 118.69 | 123.27 |
| Camarilla | 97.68 | 98.90 | 100.12 | 101.33 | 102.55 | 103.76 | 104.98 |
| Woodie | 81.44 | 91.15 | 94.70 | 104.41 | 107.96 | 117.67 | 121.22 |
| Fibonacci | 92.17 | 97.24 | 100.37 | 105.43 | 110.50 | 113.63 | 118.69 |
Numerical data
The following is the status of technical indicators and moving averages registered at the time this technical analysis was created:
| RSI (14): | 48.12 | |
| MACD (12,26,9): | -0.4800 | |
| Directional Movement: | 19.55 | |
| AROON (14): | 7.14 | |
| DEMA (21): | 102.43 | |
| Parabolic SAR (0,02-0,02-0,2): | 101.65 | |
| Elder Ray (13): | 1.29 | |
| Super Trend (3,10): | 104.05 | |
| Zig ZAG (10): | 103.00 | |
| VORTEX (21): | 0.9200 | |
| Stochastique (14,3,5): | 9.57 | |
| TEMA (21): | 102.05 | |
| Williams %R (14): | -75.31 | |
| Chande Momentum Oscillator (20): | -0.48 | |
| Repulse (5,40,3): | -5.1300 | |
| ROCnROLL: | 2 | |
| TRIX (15,9): | -0.0700 | |
| Courbe Coppock: | 2.53 |
| MA7: | 103.71 | |
| MA20: | 103.32 | |
| MA50: | 105.14 | |
| MA100: | 109.29 | |
| MAexp7: | 102.52 | |
| MAexp20: | 103.05 | |
| MAexp50: | 103.48 | |
| MAexp100: | 103.65 | |
| Price / MA7: | -0.82% | |
| Price / MA20: | -0.45% | |
| Price / MA50: | -2.17% | |
| Price / MA100: | -5.88% | |
| Price / MAexp7: | +0.33% | |
| Price / MAexp20: | -0.18% | |
| Price / MAexp50: | -0.60% | |
| Price / MAexp100: | -0.76% |
News
The last news published on BAIDU INC. ADS at the time of the generation of this analysis was as follows:
- Baidu, Inc. Files Its Annual Report on Form 20-F
- Baidu Launches China's First 24/7 Robotaxi Service
- Baidu Announces Fourth Quarter and Fiscal Year 2023 Results
- Baidu to Report Fourth Quarter and Fiscal Year 2023 Financial Results on February 28, 2024
- Baidu Global MediaGo Announces Collaboration with Amazon Publisher Services
About author
Online


Add a comment
Comments
0 comments on the analysis BAIDU INC. ADS - 1H