BAIDU INC. ADS - 1H - Technical analysis published on 03/11/2024 (GMT)
- 90
- 0
Click here for a new analysis!
- Timeframe : 1H
- - Analysis generated on
- Status : TARGET REACHED

Summary of the analysis

Additional analysis
Quotes
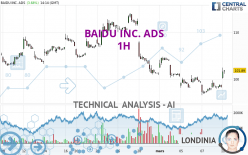
The BAIDU INC. ADS price is 101.80 USD. The price registered an increase of +3.59% on the session and was traded between 100.07 USD and 102.50 USD over the period. The price is currently at +1.73% from its lowest and -0.68% from its highest.A bullish gap was detected at the opening by the Central Gaps scanner. There are a lot of buyers and they have the upper hand in the very short term.
Opening Gap UP
Type : Bullish
Timeframe : Openning
A study of price movements over other periods shows the following variations:
Near a new LOW record (1 year)
Type : Bearish
Timeframe : Weekly
Near a new LOW record (1st january)
Type : Bearish
Timeframe : Weekly
Near a new LOW record (1 month)
Type : Bearish
Timeframe : Weekly
Technical
Technical analysis of this 1H chart of BAIDU INC. ADS indicates that the overall trend is slightly bearish. 57.14% of the signals given by moving averages are bearish. Caution: the strong bullish signals currently being given by short-term moving averages indicate that this slightly bearish trend could quickly be reversed. The Central Indicators market scanner is currently detecting a bullish signal that could impact this trend:
Bullish trend reversal : adaptative moving average 50
Type : Bullish
Timeframe : 1 hour
In fact, according to the parameters integrated into the Central Analyzer system, 16 technical indicators out of 18 analysed are currently bullish. But beware of excesses. The Central Indicators scanner currently detects this:
CCI indicator is overbought : over 100
Type : Neutral
Timeframe : 1 hour
Previous candle closed over Bollinger bands
Type : Neutral
Timeframe : 1 hour
Pivot points : price is over resistance 1
Type : Neutral
Timeframe : Weekly
Pivot points : price is over resistance 3
Type : Neutral
Timeframe : 1 hour
Central Patterns, the market scanner focusing on chart patterns, resistances and supports found these results:
Near horizontal support
Type : Bullish
Timeframe : 1 hour
Near support of channel
Type : Bullish
Timeframe : 1 hour
The Central Candlesticks scanner, specialised in Japanese candlesticks, did not identify any signals.
| S3 | S2 | S1 | Price | R1 | R2 | R3 | |
|---|---|---|---|---|---|---|---|
| ProTrendLines | 83.60 | 96.58 | 98.16 | 101.80 | 102.06 | 105.34 | 109.08 |
| Change (%) | -17.88% | -5.13% | -3.58% | - | +0.26% | +3.48% | +7.15% |
| Change | -18.20 | -5.22 | -3.64 | - | +0.26 | +3.54 | +7.28 |
| Level | Major | Intermediate | Minor | - | Intermediate | Major | Minor |
To determine price objectives, it is also possible to use the pivot points. Here is the price position in relation to pivot points:
| Pivot points | S3 | S2 | S1 | PP | R1 | R2 | R3 |
|---|---|---|---|---|---|---|---|
| Standard | 95.80 | 96.90 | 97.58 | 98.68 | 99.36 | 100.46 | 101.14 |
| Camarilla | 97.78 | 97.94 | 98.11 | 98.27 | 98.43 | 98.60 | 98.76 |
| Woodie | 95.60 | 96.80 | 97.38 | 98.58 | 99.16 | 100.36 | 100.94 |
| Fibonacci | 96.90 | 97.58 | 98.00 | 98.68 | 99.36 | 99.78 | 100.46 |
| Pivot points | S3 | S2 | S1 | PP | R1 | R2 | R3 |
|---|---|---|---|---|---|---|---|
| Standard | 89.08 | 92.83 | 95.55 | 99.30 | 102.02 | 105.77 | 108.49 |
| Camarilla | 96.49 | 97.08 | 97.68 | 98.27 | 98.86 | 99.46 | 100.05 |
| Woodie | 88.57 | 92.57 | 95.04 | 99.04 | 101.51 | 105.51 | 107.98 |
| Fibonacci | 92.83 | 95.30 | 96.83 | 99.30 | 101.77 | 103.30 | 105.77 |
| Pivot points | S3 | S2 | S1 | PP | R1 | R2 | R3 |
|---|---|---|---|---|---|---|---|
| Standard | 83.49 | 92.17 | 96.75 | 105.43 | 110.01 | 118.69 | 123.27 |
| Camarilla | 97.68 | 98.90 | 100.12 | 101.33 | 102.55 | 103.76 | 104.98 |
| Woodie | 81.44 | 91.15 | 94.70 | 104.41 | 107.96 | 117.67 | 121.22 |
| Fibonacci | 92.17 | 97.24 | 100.37 | 105.43 | 110.50 | 113.63 | 118.69 |
Numerical data
The following is the status of technical indicators and moving averages registered at the time this technical analysis was created:
| RSI (14): | 63.44 | |
| MACD (12,26,9): | -0.0700 | |
| Directional Movement: | 24.72 | |
| AROON (14): | 92.86 | |
| DEMA (21): | 98.81 | |
| Parabolic SAR (0,02-0,02-0,2): | 97.22 | |
| Elder Ray (13): | 2.16 | |
| Super Trend (3,10): | 98.22 | |
| Zig ZAG (10): | 101.39 | |
| VORTEX (21): | 0.9900 | |
| Stochastique (14,3,5): | 72.21 | |
| TEMA (21): | 99.71 | |
| Williams %R (14): | -22.05 | |
| Chande Momentum Oscillator (20): | 3.81 | |
| Repulse (5,40,3): | 0.1900 | |
| ROCnROLL: | 1 | |
| TRIX (15,9): | -0.0900 | |
| Courbe Coppock: | 2.19 |
| MA7: | 99.95 | |
| MA20: | 104.67 | |
| MA50: | 107.49 | |
| MA100: | 109.81 | |
| MAexp7: | 99.72 | |
| MAexp20: | 99.23 | |
| MAexp50: | 100.69 | |
| MAexp100: | 102.67 | |
| Price / MA7: | +1.85% | |
| Price / MA20: | -2.74% | |
| Price / MA50: | -5.29% | |
| Price / MA100: | -7.29% | |
| Price / MAexp7: | +2.09% | |
| Price / MAexp20: | +2.59% | |
| Price / MAexp50: | +1.10% | |
| Price / MAexp100: | -0.85% |
News
Don't forget to follow the news on BAIDU INC. ADS. At the time of publication of this analysis, the latest news was as follows:
- Baidu Launches China's First 24/7 Robotaxi Service
- Baidu Announces Fourth Quarter and Fiscal Year 2023 Results
- Baidu to Report Fourth Quarter and Fiscal Year 2023 Financial Results on February 28, 2024
- Baidu Global MediaGo Announces Collaboration with Amazon Publisher Services
- Baidu Responds to Recent Media Reports on Ernie Bot
About author
Online


Add a comment
Comments
0 comments on the analysis BAIDU INC. ADS - 1H