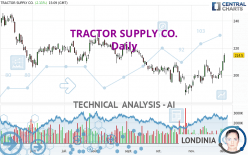
TRACTOR SUPPLY CO. - Daily - Technical analysis published on 12/04/2023 (GMT)
- 146
- 0
Click here for a new analysis!
- Timeframe : Daily
- - Analysis generated on
- Status : TARGET REACHED

Summary of the analysis

Additional analysis
Quotes
TRACTOR SUPPLY CO. rating 214.50 USD. The price has increased by +2.11% since the last closing with the lowest point at 209.01 USD and the highest point at 215.89 USD. The deviation from the price is +2.63% for the low point and -0.64% for the high point.The Central Gaps scanner detects a bearish opening. A small advantage for sellers in the very short term.
Bearish opening
Type : Bearish
Timeframe : Openning
Here is a more detailed summary of the historical variations registered by TRACTOR SUPPLY CO.:
New HIGH record (1 month)
Type : Bullish
Timeframe : Weekly
Technical
Technical analysis of this Daily chart of TRACTOR SUPPLY CO. indicates that the overall trend is bullish. 75.00% of the signals given by moving averages are bullish. This bullish trend is supported by the strong bullish signals given by short-term moving averages. The Central Indicators market scanner is currently detecting several bullish signals that could impact this trend:
Bullish trend reversal : Moving Average 50
Type : Bullish
Timeframe : Daily
Bullish trend reversal : adaptative moving average 100
Type : Bullish
Timeframe : Daily
Bullish price crossover with adaptative moving average 100
Type : Bullish
Timeframe : Daily
In fact, 15 technical indicators on 18 studied are currently positioned bullish. Caution: the Central Indicators scanner currently detects an excess:
CCI indicator is overbought : over 100
Type : Neutral
Timeframe : Daily
Williams %R indicator is overbought : over -20
Type : Neutral
Timeframe : Daily
Pivot points : price is over resistance 1
Type : Neutral
Timeframe : Daily
The Central Patterns scanner, which studies chart patterns, resistances and supports, has identified these signals:
Near horizontal resistance
Type : Bearish
Timeframe : Daily
Resistance of channel is broken
Type : Bullish
Timeframe : Daily
The Central Candlesticks scanner which studies Japanese candlesticks did not detect anything.
| S3 | S2 | S1 | Price | R1 | R2 | R3 | |
|---|---|---|---|---|---|---|---|
| ProTrendLines | 194.16 | 203.78 | 208.97 | 214.50 | 222.08 | 229.72 | 240.15 |
| Change (%) | -9.48% | -5.00% | -2.58% | - | +3.53% | +7.10% | +11.96% |
| Change | -20.34 | -10.72 | -5.53 | - | +7.58 | +15.22 | +25.65 |
| Level | Intermediate | Major | Major | - | Intermediate | Intermediate | Minor |
Attention could also be paid to pivot points to set price objectives:
| Pivot points | S3 | S2 | S1 | PP | R1 | R2 | R3 |
|---|---|---|---|---|---|---|---|
| Standard | 198.11 | 200.57 | 205.32 | 207.78 | 212.53 | 214.99 | 219.74 |
| Camarilla | 208.09 | 208.75 | 209.41 | 210.07 | 210.73 | 211.39 | 212.05 |
| Woodie | 199.26 | 201.14 | 206.47 | 208.35 | 213.68 | 215.56 | 220.89 |
| Fibonacci | 200.57 | 203.32 | 205.03 | 207.78 | 210.53 | 212.24 | 214.99 |
| Pivot points | S3 | S2 | S1 | PP | R1 | R2 | R3 |
|---|---|---|---|---|---|---|---|
| Standard | 188.06 | 192.53 | 201.30 | 205.77 | 214.54 | 219.01 | 227.78 |
| Camarilla | 206.43 | 207.64 | 208.86 | 210.07 | 211.28 | 212.50 | 213.71 |
| Woodie | 190.21 | 193.61 | 203.45 | 206.85 | 216.69 | 220.09 | 229.93 |
| Fibonacci | 192.53 | 197.59 | 200.71 | 205.77 | 210.83 | 213.95 | 219.01 |
| Pivot points | S3 | S2 | S1 | PP | R1 | R2 | R3 |
|---|---|---|---|---|---|---|---|
| Standard | 167.20 | 177.14 | 190.08 | 200.02 | 212.96 | 222.90 | 235.84 |
| Camarilla | 196.72 | 198.82 | 200.91 | 203.01 | 205.11 | 207.21 | 209.30 |
| Woodie | 168.69 | 177.89 | 191.57 | 200.77 | 214.45 | 223.65 | 237.33 |
| Fibonacci | 177.14 | 185.88 | 191.28 | 200.02 | 208.76 | 214.16 | 222.90 |
Numerical data
The following is the status of technical indicators and moving averages registered at the time this technical analysis was created:
| RSI (14): | 69.60 | |
| MACD (12,26,9): | 2.0700 | |
| Directional Movement: | 16.24 | |
| AROON (14): | 57.14 | |
| DEMA (21): | 203.52 | |
| Parabolic SAR (0,02-0,02-0,2): | 193.07 | |
| Elder Ray (13): | 9.47 | |
| Super Trend (3,10): | 197.19 | |
| Zig ZAG (10): | 214.49 | |
| VORTEX (21): | 1.1300 | |
| Stochastique (14,3,5): | 83.60 | |
| TEMA (21): | 206.63 | |
| Williams %R (14): | -8.33 | |
| Chande Momentum Oscillator (20): | 7.40 | |
| Repulse (5,40,3): | 5.9800 | |
| ROCnROLL: | 1 | |
| TRIX (15,9): | 0.0400 | |
| Courbe Coppock: | 5.75 |
| MA7: | 203.23 | |
| MA20: | 200.67 | |
| MA50: | 199.88 | |
| MA100: | 207.76 | |
| MAexp7: | 205.41 | |
| MAexp20: | 201.73 | |
| MAexp50: | 202.16 | |
| MAexp100: | 206.27 | |
| Price / MA7: | +5.55% | |
| Price / MA20: | +6.89% | |
| Price / MA50: | +7.31% | |
| Price / MA100: | +3.24% | |
| Price / MAexp7: | +4.43% | |
| Price / MAexp20: | +6.33% | |
| Price / MAexp50: | +6.10% | |
| Price / MAexp100: | +3.99% |
News
The last news published on TRACTOR SUPPLY CO. at the time of the generation of this analysis was as follows:
- Tractor Supply Company Launches the "Dad Squad" Holiday Shopping Service
- Tractor Supply Unwraps Top Gift Picks for 2023 Holiday Season
- Thinking about trading options or stock in Tesla, C3.ai, Macy's, Crinetics Pharmaceuticals, or Tractor Supply?
- Tractor Supply Announces Inaugural Class of FFA Future Leaders Scholarship Recipients
- Tractor Supply Opens Applications for “Growing Life Out Here” Open Buying Days Event
About author
Online


Add a comment
Comments
0 comments on the analysis TRACTOR SUPPLY CO. - Daily