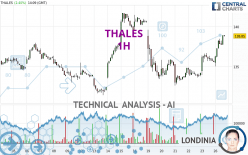
THALES - 1H - Technical analysis published on 02/26/2024 (GMT)
- 105
- 0
Click here for a new analysis!
- Timeframe : 1H
- - Analysis generated on
- Status : INVALID

Summary of the analysis

Additional analysis
Quotes
THALES rating 138.90 EUR. The price registered an increase of +2.43% on the session with the lowest point at 135.05 EUR and the highest point at 138.95 EUR. The deviation from the price is +2.85% for the low point and -0.04% for the high point.A bearish opening was detected by the Central Gaps scanner. Sellers are trying to impose a bearish trend in the very short term.
Bearish opening
Type : Bearish
Timeframe : Openning
A study of price movements over other periods shows the following variations:
Near a new HIGH record (5 years)
Type : Bullish
Timeframe : Weekly
Near a new HIGH record (1 year)
Type : Bullish
Timeframe : Weekly
Near a new HIGH record (1st january)
Type : Bullish
Timeframe : Weekly
Near a new LOW record (1 month)
Type : Bearish
Timeframe : Weekly
Technical
Technical analysis of THALES in 1H shows a strongly overall bullish trend. 89.29% of the signals given by moving averages are bullish. The overall trend is supported by the strong bullish signals from short-term moving averages. The Central Indicators market scanner is currently detecting a bullish signal that could impact this trend:
Bullish trend reversal : Moving Average 50
Type : Bullish
Timeframe : 1 hour
In fact, according to the parameters integrated into the Central Analyzer system, 15 technical indicators out of 18 analysed are currently bullish. But beware of excesses. The Central Indicators scanner currently detects this:
RSI indicator is overbought : over 70
Type : Neutral
Timeframe : 1 hour
CCI indicator is overbought : over 100
Type : Neutral
Timeframe : 1 hour
Williams %R indicator is overbought : over -20
Type : Neutral
Timeframe : 1 hour
Pivot points : price is over resistance 2
Type : Neutral
Timeframe : 1 hour
Price is back over the pivot point
Type : Bullish
Timeframe : Weekly
An analysis of the price chart with the Central Patterns scanner (detector of chart patterns and resistances and supports) shows several results that can have an impact on the price change:
Near horizontal resistance
Type : Bearish
Timeframe : 1 hour
Resistance of channel is broken
Type : Bullish
Timeframe : 1 hour
No result was found by the Central Candlesticks scanner on Japanese candlesticks.
| S3 | S2 | S1 | Price | R1 | R2 | R3 | |
|---|---|---|---|---|---|---|---|
| ProTrendLines | 135.45 | 137.00 | 138.02 | 138.90 | 139.48 | 141.85 | 143.54 |
| Change (%) | -2.48% | -1.37% | -0.63% | - | +0.42% | +2.12% | +3.34% |
| Change | -3.45 | -1.90 | -0.88 | - | +0.58 | +2.95 | +4.64 |
| Level | Intermediate | Intermediate | Major | - | Major | Major | Intermediate |
Attention could also be paid to pivot points to set price objectives:
| Pivot points | S3 | S2 | S1 | PP | R1 | R2 | R3 |
|---|---|---|---|---|---|---|---|
| Standard | 131.38 | 132.67 | 134.13 | 135.42 | 136.88 | 138.17 | 139.63 |
| Camarilla | 134.84 | 135.10 | 135.35 | 135.60 | 135.85 | 136.10 | 136.36 |
| Woodie | 131.48 | 132.71 | 134.23 | 135.46 | 136.98 | 138.21 | 139.73 |
| Fibonacci | 132.67 | 133.72 | 134.37 | 135.42 | 136.47 | 137.12 | 138.17 |
| Pivot points | S3 | S2 | S1 | PP | R1 | R2 | R3 |
|---|---|---|---|---|---|---|---|
| Standard | 125.35 | 129.00 | 132.30 | 135.95 | 139.25 | 142.90 | 146.20 |
| Camarilla | 133.69 | 134.33 | 134.96 | 135.60 | 136.24 | 136.87 | 137.51 |
| Woodie | 125.18 | 128.91 | 132.13 | 135.86 | 139.08 | 142.81 | 146.03 |
| Fibonacci | 129.00 | 131.66 | 133.30 | 135.95 | 138.61 | 140.25 | 142.90 |
| Pivot points | S3 | S2 | S1 | PP | R1 | R2 | R3 |
|---|---|---|---|---|---|---|---|
| Standard | 120.75 | 126.45 | 130.90 | 136.60 | 141.05 | 146.75 | 151.20 |
| Camarilla | 132.56 | 133.49 | 134.42 | 135.35 | 136.28 | 137.21 | 138.14 |
| Woodie | 120.13 | 126.14 | 130.28 | 136.29 | 140.43 | 146.44 | 150.58 |
| Fibonacci | 126.45 | 130.33 | 132.72 | 136.60 | 140.48 | 142.87 | 146.75 |
Numerical data
The following are the details of the technical indicators and moving averages that were collected to generate this technical analysis:
| RSI (14): | 72.17 | |
| MACD (12,26,9): | 0.9100 | |
| Directional Movement: | 28.31 | |
| AROON (14): | 35.72 | |
| DEMA (21): | 137.70 | |
| Parabolic SAR (0,02-0,02-0,2): | 136.16 | |
| Elder Ray (13): | 1.65 | |
| Super Trend (3,10): | 136.79 | |
| Zig ZAG (10): | 138.90 | |
| VORTEX (21): | 1.3200 | |
| Stochastique (14,3,5): | 94.51 | |
| TEMA (21): | 138.57 | |
| Williams %R (14): | -2.56 | |
| Chande Momentum Oscillator (20): | 2.60 | |
| Repulse (5,40,3): | 0.7600 | |
| ROCnROLL: | 1 | |
| TRIX (15,9): | 0.0600 | |
| Courbe Coppock: | 3.87 |
| MA7: | 136.19 | |
| MA20: | 135.79 | |
| MA50: | 135.83 | |
| MA100: | 136.72 | |
| MAexp7: | 137.92 | |
| MAexp20: | 136.68 | |
| MAexp50: | 136.04 | |
| MAexp100: | 135.93 | |
| Price / MA7: | +1.99% | |
| Price / MA20: | +2.29% | |
| Price / MA50: | +2.26% | |
| Price / MA100: | +1.59% | |
| Price / MAexp7: | +0.71% | |
| Price / MAexp20: | +1.62% | |
| Price / MAexp50: | +2.10% | |
| Price / MAexp100: | +2.18% |
News
The latest news and videos published on THALES at the time of the analysis were as follows:
- Paradise Mobile relies on Thales to deliver seamless connectivity in the Caribbean Region
- CompoSecure, IDEMIA, and Thales Named Market Leaders in ABI Research's Metal Payment Card Competitive Ranking
- CompoSecure, IDEMIA, and Thales Named Market Leaders in ABI Research's Metal Payment Card Competitive Ranking
- Thoma Bravo Completes Sale of Imperva to Thales
- Hitachi Rail secures clearance for EUR1,660m Thales GTS acquisition
About author
Online


Add a comment
Comments
0 comments on the analysis THALES - 1H