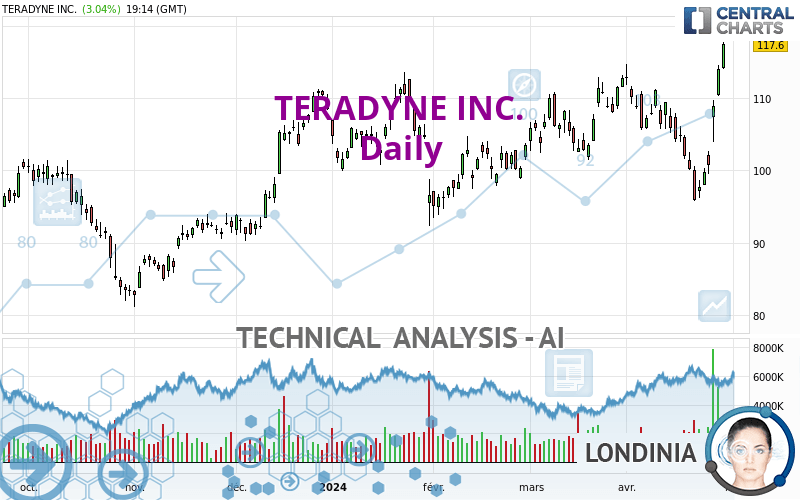
TERADYNE INC. - Daily - Technical analysis published on 04/29/2024 (GMT)
- 82
- 0
Click here for a new analysis!
- Timeframe : Daily
- - Analysis generated on
- Status : TARGET REACHED

Summary of the analysis

Additional analysis
Quotes
TERADYNE INC. rating 117.60 USD. On the day, this instrument gained +3.04% and was between 114.00 USD and 117.81 USD. This implies that the price is at +3.16% from its lowest and at -0.18% from its highest.So that you have an overall view of the price change, here is a table showing the variations over several periods:
Near a new HIGH record (1 year)
Type : Bullish
Timeframe : Weekly
New HIGH record (1st january)
Type : Bullish
Timeframe : Weekly
New HIGH record (1 month)
Type : Bullish
Timeframe : Weekly
The Central Volumes scanner detects abnormal volumes on the asset:
Abnormal volumes
Timeframe : 5 days
Technical
Technical analysis of TERADYNE INC. in Daily shows a strongly overall bullish trend. 92.86% of the signals given by moving averages are bullish. This strongly bullish trend is supported by the strong bullish signals given by short-term moving averages. The Central Indicators market scanner is currently detecting a bullish signal that could impact this trend:
Bullish trend reversal : Moving Average 20
Type : Bullish
Timeframe : Daily
Technical indicators are strongly bullish, suggesting that the price increase should continue.
But beware of excesses. The Central Indicators scanner currently detects this:
CCI indicator is overbought : over 100
Type : Neutral
Timeframe : Daily
Williams %R indicator is overbought : over -20
Type : Neutral
Timeframe : Daily
Pivot points : price is over resistance 1
Type : Neutral
Timeframe : Daily
MACD indicator is back over 0
Type : Bullish
Timeframe : Daily
The Central Patterns scanner, which studies chart patterns, resistances and supports, has identified these signals:
Near horizontal resistance
Type : Bearish
Timeframe : Daily
Resistance of channel is broken
Type : Bullish
Timeframe : Daily
No result was found by the Central Candlesticks scanner on Japanese candlesticks.
| S3 | S2 | S1 | Price | R1 | R2 | R3 | |
|---|---|---|---|---|---|---|---|
| ProTrendLines | 108.24 | 110.93 | 116.82 | 117.60 | 132.67 | 141.78 | 166.87 |
| Change (%) | -7.96% | -5.67% | -0.66% | - | +12.81% | +20.56% | +41.90% |
| Change | -9.36 | -6.67 | -0.78 | - | +15.07 | +24.18 | +49.27 |
| Level | Minor | Major | Major | - | Minor | Intermediate | Major |
Pivot points can also be used to set your price objectives. Here is the price situation in relation to pivot points:
| Pivot points | S3 | S2 | S1 | PP | R1 | R2 | R3 |
|---|---|---|---|---|---|---|---|
| Standard | 106.98 | 108.62 | 111.38 | 113.02 | 115.78 | 117.42 | 120.18 |
| Camarilla | 112.92 | 113.32 | 113.73 | 114.13 | 114.53 | 114.94 | 115.34 |
| Woodie | 107.53 | 108.90 | 111.93 | 113.30 | 116.33 | 117.70 | 120.73 |
| Fibonacci | 108.62 | 110.30 | 111.34 | 113.02 | 114.70 | 115.74 | 117.42 |
| Pivot points | S3 | S2 | S1 | PP | R1 | R2 | R3 |
|---|---|---|---|---|---|---|---|
| Standard | 83.53 | 89.86 | 102.00 | 108.33 | 120.47 | 126.80 | 138.94 |
| Camarilla | 109.05 | 110.74 | 112.44 | 114.13 | 115.82 | 117.52 | 119.21 |
| Woodie | 86.43 | 91.31 | 104.90 | 109.78 | 123.37 | 128.25 | 141.84 |
| Fibonacci | 89.86 | 96.92 | 101.28 | 108.33 | 115.39 | 119.75 | 126.80 |
| Pivot points | S3 | S2 | S1 | PP | R1 | R2 | R3 |
|---|---|---|---|---|---|---|---|
| Standard | 93.35 | 97.42 | 105.13 | 109.20 | 116.91 | 120.98 | 128.69 |
| Camarilla | 109.59 | 110.67 | 111.75 | 112.83 | 113.91 | 114.99 | 116.07 |
| Woodie | 95.16 | 98.33 | 106.94 | 110.11 | 118.72 | 121.89 | 130.50 |
| Fibonacci | 97.42 | 101.92 | 104.70 | 109.20 | 113.70 | 116.48 | 120.98 |
Numerical data
The following is the status of the technical indicators and moving averages at the time of publication of this technical analysis:
| RSI (14): | 65.39 | |
| MACD (12,26,9): | 0.6600 | |
| Directional Movement: | 21.76 | |
| AROON (14): | 42.86 | |
| DEMA (21): | 106.79 | |
| Parabolic SAR (0,02-0,02-0,2): | 96.82 | |
| Elder Ray (13): | 9.22 | |
| Super Trend (3,10): | 103.85 | |
| Zig ZAG (10): | 117.08 | |
| VORTEX (21): | 0.9000 | |
| Stochastique (14,3,5): | 92.90 | |
| TEMA (21): | 107.18 | |
| Williams %R (14): | -2.95 | |
| Chande Momentum Oscillator (20): | 7.74 | |
| Repulse (5,40,3): | 6.8300 | |
| ROCnROLL: | 1 | |
| TRIX (15,9): | -0.0900 | |
| Courbe Coppock: | 3.76 |
| MA7: | 104.94 | |
| MA20: | 105.95 | |
| MA50: | 105.71 | |
| MA100: | 104.20 | |
| MAexp7: | 108.55 | |
| MAexp20: | 106.32 | |
| MAexp50: | 105.49 | |
| MAexp100: | 103.83 | |
| Price / MA7: | +12.06% | |
| Price / MA20: | +11.00% | |
| Price / MA50: | +11.25% | |
| Price / MA100: | +12.86% | |
| Price / MAexp7: | +8.34% | |
| Price / MAexp20: | +10.61% | |
| Price / MAexp50: | +11.48% | |
| Price / MAexp100: | +13.26% |
News
The last news published on TERADYNE INC. at the time of the generation of this analysis was as follows:
- Teradyne Reports First Quarter 2024 Results
- Teradyne Honored as a 2024 VETS Indexes Recognized Employer
- Teradyne to Announce First Quarter 2024 Results
- Teradyne Robotics to bring the power of AI to robotics with NVIDIA
-
 Our Robots Are Built To Work With Humans: Teradyne CEO | CNBC
About author
Online


Add a comment
Comments
0 comments on the analysis TERADYNE INC. - Daily