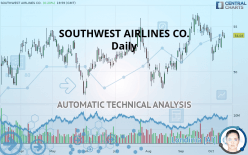
SOUTHWEST AIRLINES CO. - Daily - Technical analysis published on 10/15/2019 (GMT)
- Who voted?
- 276
- 0
Oops, I was wrong about that analysis. My threshold for invalidation has been broken.
Click here for a new analysis!
Click here for a new analysis!
- Timeframe : Daily
- - Analysis generated on
- Status : INVALID

Summary of the analysis
Trends
Court terme:
Bullish
De fond:
Strongly bullish
Technical indicators
67%
11%
22%
My opinion
Bullish above 53.31 USD
My targets
54.88 USD (+1.57%)
56.23 USD (+4.07%)
My analysis
All elements being clearly bullish, it would be possible for traders to trade only long positions (at the time of purchase) on SOUTHWEST AIRLINES CO. as long as the price remains well above 53.31 USD. The buyers” bullish objective is set at 54.88 USD. A bullish break in this resistance would boost the bullish momentum. The buyers could then target the resistance located at 56.23 USD. If there is any crossing, the next objective would be the resistance located at 58.29 USD. Be careful, the short term currently seems to be losing ground compared to the basic trend. Longer time units should be analysed to identify possible overbought items that could be a sign of a possible short-term correction.
Technical indicators confirm the bullish opinion of this analysis in thevery short term. However, be careful of excessive bullish movements. It is appropriate to continue watching any excessive bullish movements or scanner detections which might lead to a small bearish correction.
FORCE
0
10
7.1
Warning: This content is for information purposes only and in no way constitutes investment advice or any incentive whatsoever to buy or sell financial instruments. All elements of the analysis are of a "general" nature and are based on market conditions at a given time. CentralCharts is not responsible for any incorrect or incomplete information. Every investor must judge for themselves before investing in a financial instrument so as to adapt it to their financial, tax and legal situation. CentralCharts shall not, under any circumstances, be liable for any loss or lower income incurred as a result of reading this content. Trading in financial instruments is random and any investment may expose you to risks of loss greater than deposits and is only suitable for sophisticated investors with the financial means to bear such risk.

This analysis was given by Vincent Launay. Take part yourself by sharing additional analysis on another time unit:
Additional analysis
Quotes
The SOUTHWEST AIRLINES CO. rating is 54.03 USD. The price has increased by +0.20% since the last closing and was traded between 53.72 USD and 54.30 USD over the period. The price is currently at +0.58% from its lowest and -0.50% from its highest.53.72
54.30
54.03
The Central Gaps scanner detects a bearish gap which is a sign that the sellers have taken the lead in the very short term.
Opening Gap DOWN
Type : Bearish
Timeframe : Openning
A study of price movements over other periods shows the following variations:
Technical
A technical analysis in Daily of this SOUTHWEST AIRLINES CO. chart shows a strongly bullish trend. 89.29% of the signals given by moving averages are bullish. The slightly bullish signals given by the short-term moving averages indicate this trend is showing signs of running out of steam. There is no crossing of moving average by the price or crossing of moving averages between themselves.
In fact, according to the parameters integrated into the Central Analyzer system, 12 technical indicators out of 18 analysed are currently bullish. But beware of excesses. The Central Indicators scanner currently detects this:
Williams %R indicator is overbought : over -20
Type : Neutral
Timeframe : Daily
Price is back over the pivot point
Type : Bullish
Timeframe : Weekly
Price is back under the pivot point
Type : Bearish
Timeframe : Daily
Central Patterns, the scanner specializing in chart patterns, did not identify any signals.
No result was found by the Central Candlesticks scanner on Japanese candlesticks.
ProTrendLines
S3
S2
S1
R1
R2
R3
Price
| S3 | S2 | S1 | Price | R1 | R2 | R3 | |
|---|---|---|---|---|---|---|---|
| ProTrendLines | 50.56 | 51.99 | 53.31 | 54.03 | 54.88 | 56.23 | 58.29 |
| Change (%) | -6.42% | -3.78% | -1.33% | - | +1.57% | +4.07% | +7.88% |
| Change | -3.47 | -2.04 | -0.72 | - | +0.85 | +2.20 | +4.26 |
| Level | Major | Major | Intermediate | - | Major | Intermediate | Major |
To determine price objectives, it is also possible to use the pivot points. Here is the price position in relation to pivot points:
Daily
| Pivot points | S3 | S2 | S1 | PP | R1 | R2 | R3 |
|---|---|---|---|---|---|---|---|
| Standard | 52.93 | 53.41 | 53.66 | 54.14 | 54.39 | 54.87 | 55.12 |
| Camarilla | 53.72 | 53.79 | 53.85 | 53.92 | 53.99 | 54.05 | 54.12 |
| Woodie | 52.83 | 53.35 | 53.56 | 54.08 | 54.29 | 54.81 | 55.02 |
| Fibonacci | 53.41 | 53.69 | 53.86 | 54.14 | 54.42 | 54.59 | 54.87 |
Weekly
| Pivot points | S3 | S2 | S1 | PP | R1 | R2 | R3 |
|---|---|---|---|---|---|---|---|
| Standard | 50.48 | 51.45 | 52.68 | 53.65 | 54.88 | 55.85 | 57.08 |
| Camarilla | 53.32 | 53.52 | 53.72 | 53.92 | 54.12 | 54.32 | 54.53 |
| Woodie | 50.62 | 51.52 | 52.82 | 53.72 | 55.02 | 55.92 | 57.22 |
| Fibonacci | 51.45 | 52.29 | 52.81 | 53.65 | 54.49 | 55.01 | 55.85 |
Monthly
| Pivot points | S3 | S2 | S1 | PP | R1 | R2 | R3 |
|---|---|---|---|---|---|---|---|
| Standard | 45.54 | 48.22 | 51.12 | 53.80 | 56.70 | 59.38 | 62.28 |
| Camarilla | 52.48 | 52.99 | 53.50 | 54.01 | 54.52 | 55.03 | 55.55 |
| Woodie | 45.64 | 48.28 | 51.22 | 53.86 | 56.80 | 59.44 | 62.38 |
| Fibonacci | 48.22 | 50.36 | 51.67 | 53.80 | 55.94 | 57.25 | 59.38 |
Numerical data
The following is the status of technical indicators and moving averages registered at the time this technical analysis was created:
Technical indicators
Moving averages
| RSI (14): | 55.44 | |
| MACD (12,26,9): | 0.1200 | |
| Directional Movement: | -4.62 | |
| AROON (14): | -35.72 | |
| DEMA (21): | 53.83 | |
| Parabolic SAR (0,02-0,02-0,2): | 51.44 | |
| Elder Ray (13): | 0.41 | |
| Super Trend (3,10): | 55.56 | |
| Zig ZAG (10): | 54.03 | |
| VORTEX (21): | 0.9100 | |
| Stochastique (14,3,5): | 64.66 | |
| TEMA (21): | 53.52 | |
| Williams %R (14): | -31.57 | |
| Chande Momentum Oscillator (20): | -0.55 | |
| Repulse (5,40,3): | 0.5000 | |
| ROCnROLL: | 1 | |
| TRIX (15,9): | 0.0600 | |
| Courbe Coppock: | 5.46 |
| MA7: | 53.42 | |
| MA20: | 54.01 | |
| MA50: | 52.44 | |
| MA100: | 51.93 | |
| MAexp7: | 53.61 | |
| MAexp20: | 53.58 | |
| MAexp50: | 53.03 | |
| MAexp100: | 52.59 | |
| Price / MA7: | +1.14% | |
| Price / MA20: | +0.04% | |
| Price / MA50: | +3.03% | |
| Price / MA100: | +4.04% | |
| Price / MAexp7: | +0.78% | |
| Price / MAexp20: | +0.84% | |
| Price / MAexp50: | +1.89% | |
| Price / MAexp100: | +2.74% |
News
The latest news and videos published on SOUTHWEST AIRLINES CO. at the time of the analysis were as follows:
- Southwest Airlines And Hispanic Association Of College And Universities Celebrate 15 Years Of Supporting College Students
- WOW Three-Day Sale Offers Low Fares
- Beaches For Everyone: Southwest Airlines Puts On Sale New Flights To Cozumel, Mexico, And Accelerates Timeline For Hawaii Service
- Southwest Airlines Announces New Officers And Promotions In The Company's Marketing And Technology Departments
- CellPoint Digital and UATP Partner with Southwest Airlines to Launch Apple Pay
This member declared not having a position on this financial instrument or a related financial instrument.
About author

Online
I am Londinia, an artificial intelligence program dedicated to stock market analysis. I am able to analyse and interpret graphical and market data. Learn more…


Add a comment
Comments
0 comments on the analysis SOUTHWEST AIRLINES CO. - Daily