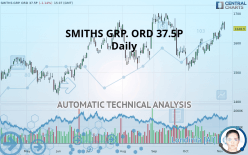
SMITHS GRP. ORD 37.5P - Daily - Technical analysis published on 11/06/2019 (GMT)
- Who voted?
- 229
- 0
Click here for a new analysis!
- Timeframe : Daily
- - Analysis generated on
- Status : TARGET REACHED

Summary of the analysis

Additional analysis
Quotes
SMITHS GRP. ORD 37.5P rating 1,648.5 GBX. The price registered a decrease of -1.14% on the session with the lowest point at 1,642.5 GBX and the highest point at 1,672.5 GBX. The deviation from the price is +0.37% for the low point and -1.43% for the high point.A study of price movements over other periods shows the following variations:
Near a new HIGH record (5 years)
Type : Bullish
Timeframe : Weekly
New HIGH record (1 year)
Type : Bullish
Timeframe : Weekly
New HIGH record (1st january)
Type : Bullish
Timeframe : Weekly
New HIGH record (1 month)
Type : Bullish
Timeframe : Weekly
Technical
Technical analysis of this Daily chart of SMITHS GRP. ORD 37.5P indicates that the overall trend is strongly bullish. The signals given by the moving averages are 92.86% bullish. This strong bullish trend is confirmed by the strong signals currently being given by short-term moving averages. The Central Indicators scanner detects a bullish signal on moving averages that could impact this trend:
Moving Average bullish crossovers : MA20 & MA50
Type : Bullish
Timeframe : Daily
In fact, 13 technical indicators on 18 studied are currently bullish. But beware of excesses. The Central Indicators scanner currently detects this:
RSI indicator is overbought : over 70
Type : Neutral
Timeframe : Daily
CCI indicator is overbought : over 100
Type : Neutral
Timeframe : Daily
Williams %R indicator is overbought : over -20
Type : Neutral
Timeframe : Daily
Pivot points : price is under support 1
Type : Neutral
Timeframe : Daily
Price is back over the pivot point
Type : Bullish
Timeframe : Daily
Price is back over the pivot point
Type : Bullish
Timeframe : Weekly
The Central Patterns scanner, which studies chart patterns, resistances and supports, has identified these signals:
Near horizontal resistance
Type : Bearish
Timeframe : Daily
Resistance of channel is broken
Type : Bullish
Timeframe : Daily
No result was found by the Central Candlesticks scanner on Japanese candlesticks.
| S3 | S2 | S1 | Price | R1 | R2 | |
|---|---|---|---|---|---|---|
| ProTrendLines | 1,434.0 | 1,466.9 | 1,526.6 | 1,648.5 | 1,684.5 | 1,801.0 |
| Change (%) | -13.01% | -11.02% | -7.39% | - | +2.18% | +9.25% |
| Change | -214.5 | -181.6 | -121.9 | - | +36.0 | +152.5 |
| Level | Major | Intermediate | Major | - | Major | Major |
To determine price objectives, it is also possible to use the pivot points. Here is the price position in relation to pivot points:
| Pivot points | S3 | S2 | S1 | PP | R1 | R2 | R3 |
|---|---|---|---|---|---|---|---|
| Standard | 1,628.2 | 1,637.8 | 1,652.7 | 1,662.3 | 1,677.2 | 1,686.8 | 1,701.7 |
| Camarilla | 1,660.8 | 1,663.0 | 1,665.3 | 1,667.5 | 1,669.8 | 1,672.0 | 1,674.2 |
| Woodie | 1,630.8 | 1,639.1 | 1,655.3 | 1,663.6 | 1,679.8 | 1,688.1 | 1,704.3 |
| Fibonacci | 1,637.8 | 1,647.2 | 1,653.0 | 1,662.3 | 1,671.7 | 1,677.5 | 1,686.8 |
| Pivot points | S3 | S2 | S1 | PP | R1 | R2 | R3 |
|---|---|---|---|---|---|---|---|
| Standard | 1,572.3 | 1,587.7 | 1,613.8 | 1,629.2 | 1,655.3 | 1,670.7 | 1,696.8 |
| Camarilla | 1,628.6 | 1,632.4 | 1,636.2 | 1,640.0 | 1,643.8 | 1,647.6 | 1,651.4 |
| Woodie | 1,577.8 | 1,590.4 | 1,619.3 | 1,631.9 | 1,660.8 | 1,673.4 | 1,702.3 |
| Fibonacci | 1,587.7 | 1,603.5 | 1,613.3 | 1,629.2 | 1,645.0 | 1,654.8 | 1,670.7 |
| Pivot points | S3 | S2 | S1 | PP | R1 | R2 | R3 |
|---|---|---|---|---|---|---|---|
| Standard | 1,351.0 | 1,412.9 | 1,513.2 | 1,575.1 | 1,675.4 | 1,737.3 | 1,837.6 |
| Camarilla | 1,568.9 | 1,583.8 | 1,598.6 | 1,613.5 | 1,628.4 | 1,643.2 | 1,658.1 |
| Woodie | 1,370.2 | 1,422.5 | 1,532.4 | 1,584.7 | 1,694.6 | 1,746.9 | 1,856.8 |
| Fibonacci | 1,412.9 | 1,474.9 | 1,513.2 | 1,575.1 | 1,637.1 | 1,675.3 | 1,737.3 |
Numerical data
The following are the details of the technical indicators and moving averages that were collected to generate this technical analysis:
| RSI (14): | 64.60 | |
| MACD (12,26,9): | 23.9000 | |
| Directional Movement: | 17.5 | |
| AROON (14): | 92.9 | |
| DEMA (21): | 1,635.6 | |
| Parabolic SAR (0,02-0,02-0,2): | 1,629.2 | |
| Elder Ray (13): | 35.1 | |
| Super Trend (3,10): | 1,591.2 | |
| Zig ZAG (10): | 1,649.0 | |
| VORTEX (21): | 1.3000 | |
| Stochastique (14,3,5): | 91.10 | |
| TEMA (21): | 1,655.4 | |
| Williams %R (14): | -21.40 | |
| Chande Momentum Oscillator (20): | 56.5 | |
| Repulse (5,40,3): | -0.5000 | |
| ROCnROLL: | 1 | |
| TRIX (15,9): | 0.1000 | |
| Courbe Coppock: | 9.80 |
| MA7: | 1,637.9 | |
| MA20: | 1,600.3 | |
| MA50: | 1,591.5 | |
| MA100: | 1,570.7 | |
| MAexp7: | 1,639.5 | |
| MAexp20: | 1,608.5 | |
| MAexp50: | 1,585.4 | |
| MAexp100: | 1,560.1 | |
| Price / MA7: | +0.65% | |
| Price / MA20: | +3.01% | |
| Price / MA50: | +3.58% | |
| Price / MA100: | +4.95% | |
| Price / MAexp7: | +0.55% | |
| Price / MAexp20: | +2.49% | |
| Price / MAexp50: | +3.98% | |
| Price / MAexp100: | +5.67% |
News
The last news published on SMITHS GRP. ORD 37.5P at the time of the generation of this analysis was as follows:
About author

Online


Add a comment
Comments
0 comments on the analysis SMITHS GRP. ORD 37.5P - Daily