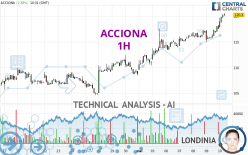
ACCIONA - 1H - Technical analysis published on 05/10/2024 (GMT)
- 68
- 0
Click here for a new analysis!
- Timeframe : 1H
- - Analysis generated on
- Status : TARGET REACHED

Summary of the analysis

Additional analysis
Quotes
The ACCIONA price is 120.2 EUR. On the day, this instrument gained +2.30% and was traded between 117.8 EUR and 120.6 EUR over the period. The price is currently at +2.04% from its lowest and -0.33% from its highest.The Central Gaps scanner detects a bullish opening marking the presence of buyers ahead of sellers at the opening but not sufficiently marked to allow the price to register a quotation gap.
Bullish opening
Type : Bullish
Timeframe : Openning
Here is a more detailed summary of the historical variations registered by ACCIONA:
New HIGH record (1 month)
Type : Bullish
Timeframe : Weekly
Technical
Technical analysis of ACCIONA in 1H shows a strongly overall bullish trend. 92.86% of the signals given by moving averages are bullish. This strongly bullish trend is supported by the strong bullish signals given by short-term moving averages. The Central Indicators market scanner currently does not detect any result that concerns moving averages.
In fact, 15 technical indicators on 18 studied are currently bullish. Caution: the Central Indicators scanner currently detects an excess:
RSI indicator is overbought : over 70
Type : Neutral
Timeframe : 1 hour
CCI indicator is overbought : over 100
Type : Neutral
Timeframe : 1 hour
Williams %R indicator is overbought : over -20
Type : Neutral
Timeframe : 1 hour
Pivot points : price is over resistance 1
Type : Neutral
Timeframe : Weekly
Pivot points : price is over resistance 2
Type : Neutral
Timeframe : 1 hour
Central Patterns, the market scanner focusing on chart patterns, resistances and supports found these results:
Near horizontal resistance
Type : Bearish
Timeframe : 1 hour
Resistance of channel is broken
Type : Bullish
Timeframe : 1 hour
From the Japanese candlestick perspective, the Central Candlesticks scanner notes the presence of these results that could impact the short-term trend:
White gravestone / inverted hammer
Type : Neutral
Timeframe : 1 hour
Black gravestone / inverted hammer
Type : Bearish
Timeframe : 1 hour
| S3 | S2 | S1 | Price | R1 | R2 | R3 | |
|---|---|---|---|---|---|---|---|
| ProTrendLines | 112.7 | 114.9 | 117.6 | 120.2 | 121.7 | 125.8 | 130.4 |
| Change (%) | -6.24% | -4.41% | -2.16% | - | +1.25% | +4.66% | +8.49% |
| Change | -7.5 | -5.3 | -2.6 | - | +1.5 | +5.6 | +10.2 |
| Level | Major | Minor | Intermediate | - | Minor | Minor | Intermediate |
Attention could also be paid to pivot points to set price objectives:
| Pivot points | S3 | S2 | S1 | PP | R1 | R2 | R3 |
|---|---|---|---|---|---|---|---|
| Standard | 112.1 | 113.5 | 115.5 | 116.9 | 118.9 | 120.3 | 122.3 |
| Camarilla | 116.6 | 116.9 | 117.2 | 117.5 | 117.8 | 118.1 | 118.4 |
| Woodie | 112.4 | 113.7 | 115.8 | 117.1 | 119.2 | 120.5 | 122.6 |
| Fibonacci | 113.5 | 114.8 | 115.6 | 116.9 | 118.2 | 119.0 | 120.3 |
| Pivot points | S3 | S2 | S1 | PP | R1 | R2 | R3 |
|---|---|---|---|---|---|---|---|
| Standard | 99.8 | 104.1 | 109.0 | 113.3 | 118.2 | 122.5 | 127.4 |
| Camarilla | 111.4 | 112.2 | 113.1 | 113.9 | 114.7 | 115.6 | 116.4 |
| Woodie | 100.1 | 104.3 | 109.3 | 113.5 | 118.5 | 122.7 | 127.7 |
| Fibonacci | 104.1 | 107.6 | 109.8 | 113.3 | 116.8 | 119.0 | 122.5 |
| Pivot points | S3 | S2 | S1 | PP | R1 | R2 | R3 |
|---|---|---|---|---|---|---|---|
| Standard | 96.7 | 100.6 | 104.7 | 108.6 | 112.7 | 116.6 | 120.7 |
| Camarilla | 106.5 | 107.2 | 108.0 | 108.7 | 109.4 | 110.2 | 110.9 |
| Woodie | 96.7 | 100.7 | 104.7 | 108.7 | 112.7 | 116.7 | 120.7 |
| Fibonacci | 100.6 | 103.7 | 105.6 | 108.6 | 111.7 | 113.6 | 116.6 |
Numerical data
The following is the status of the technical indicators and moving averages at the time of publication of this technical analysis:
| RSI (14): | 74.30 | |
| MACD (12,26,9): | 1.2000 | |
| Directional Movement: | 32.2 | |
| AROON (14): | 85.7 | |
| DEMA (21): | 118.9 | |
| Parabolic SAR (0,02-0,02-0,2): | 116.6 | |
| Elder Ray (13): | 2.3 | |
| Super Trend (3,10): | 117.7 | |
| Zig ZAG (10): | 120.1 | |
| VORTEX (21): | 1.2000 | |
| Stochastique (14,3,5): | 95.80 | |
| TEMA (21): | 119.3 | |
| Williams %R (14): | -7.00 | |
| Chande Momentum Oscillator (20): | 4.8 | |
| Repulse (5,40,3): | 0.8000 | |
| ROCnROLL: | 1 | |
| TRIX (15,9): | 0.1000 | |
| Courbe Coppock: | 4.40 |
| MA7: | 115.7 | |
| MA20: | 110.8 | |
| MA50: | 110.5 | |
| MA100: | 115.3 | |
| MAexp7: | 119.0 | |
| MAexp20: | 117.5 | |
| MAexp50: | 115.6 | |
| MAexp100: | 113.5 | |
| Price / MA7: | +3.89% | |
| Price / MA20: | +8.48% | |
| Price / MA50: | +8.78% | |
| Price / MA100: | +4.25% | |
| Price / MAexp7: | +1.01% | |
| Price / MAexp20: | +2.30% | |
| Price / MAexp50: | +3.98% | |
| Price / MAexp100: | +5.90% |
News
Don't forget to follow the news on ACCIONA. At the time of publication of this analysis, the latest news was as follows:
- Eve and Acciona enter strategic partnership to accelerate the development of a sustainable Urban Air Mobility ecosystem
- Acciona Energia Assigned ESG Evaluation Score Of 86; Preparedness Strong
- Sungrow Supplies Inverters for El Romero Solar High-Tech Hub Developed by Acciona
- Sungrow Supplies Inverters for El Romero Solar High-Tech Hub Developed by Acciona
- ACCIONA Industrial Enhances Global Materials Management with the Use of Intergraph Smart® Materials
About author
Online


Add a comment
Comments
0 comments on the analysis ACCIONA - 1H