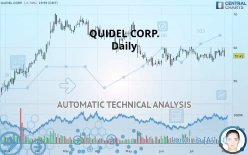
QUIDELORTHO CORP. - Daily - Technical analysis published on 08/02/2019 (GMT)
- Who voted?
- 281
- 0
I am delighted to see that my first price objective has been achieved. I hope you've taken advantage of it.
Click here for a new analysis!
Click here for a new analysis!
- Timeframe : Daily
- - Analysis generated on
- Status : TARGET REACHED

Summary of the analysis
Trends
Court terme:
Bearish
De fond:
Bearish
Technical indicators
39%
28%
33%
My opinion
Bearish under 59.61 USD
My targets
54.47 USD (-5.12%)
51.92 USD (-9.56%)
My analysis
There is a bearish trend on QUIDEL CORP. both at the basic level and in the short term. A sale could be considered, so long as the price remains below 59.61 USD. Each support break is a strong signal that the current trend will continue. The first bearish objective would be 54.47 USD. Then the price could move towards 51.92 USD. Then 47.98 USD by extension. Be careful, a return to above the resistance 59.61 USD would be a sign of a weakening of the trend and a possible rebound phase could then occur. In this case, you could keep away while waiting for a signal that the basic trend will resume. Trading against the trend is perhaps more risky.
Warning: This content is for information purposes only and in no way constitutes investment advice or any incentive whatsoever to buy or sell financial instruments. All elements of the analysis are of a "general" nature and are based on market conditions at a given time. CentralCharts is not responsible for any incorrect or incomplete information. Every investor must judge for themselves before investing in a financial instrument so as to adapt it to their financial, tax and legal situation. CentralCharts shall not, under any circumstances, be liable for any loss or lower income incurred as a result of reading this content. Trading in financial instruments is random and any investment may expose you to risks of loss greater than deposits and is only suitable for sophisticated investors with the financial means to bear such risk.

This analysis was given by Vincent Launay. Take part yourself by sharing additional analysis on another time unit:
Additional analysis
Quotes
The QUIDEL CORP. price is 57.41 USD. The price registered a decrease of -2.74% on the session and was between 57.11 USD and 59.84 USD. This implies that the price is at +0.53% from its lowest and at -4.06% from its highest.57.11
59.84
57.41
The Central Gaps scanner detects a bearish opening. A small advantage for sellers in the very short term.
Bearish opening
Type : Bearish
Timeframe : Openning
So that you have an overall view of the price change, here is a table showing the variations over several periods:
Technical
Technical analysis of QUIDEL CORP. in Daily shows an overall bearish trend. 75% of the signals given by moving averages are bearish. This bearish trend is slowing down slightly given the slightly bearish signals given by short-term moving averages. The Central Indicators market scanner is currently detecting a bullish signal that could impact this trend:
Bullish price crossover with adaptative moving average 50
Type : Bullish
Timeframe : Daily
On the 18 technical indicators analysed, 7 are bullish, 6 are neutral and 5 are bearish. But beware of excesses. The Central Indicators scanner currently detects this:
CCI indicator is overbought : over 100
Type : Neutral
Timeframe : Daily
Williams %R indicator is overbought : over -20
Type : Neutral
Timeframe : Daily
Pivot points : price is under support 3
Type : Neutral
Timeframe : Daily
Parabolic SAR indicator bullish reversal
Type : Bullish
Timeframe : Daily
Price is back over the pivot point
Type : Bullish
Timeframe : Weekly
An analysis of the price chart with the Central Patterns scanner (detector of chart patterns and resistances and supports) shows several results that can have an impact on the price change:
Near horizontal resistance
Type : Bearish
Timeframe : Daily
Near resistance of triangle
Type : Bearish
Timeframe : Daily
Resistance of channel is broken
Type : Bullish
Timeframe : Daily
No result was found by the Central Candlesticks scanner on Japanese candlesticks.
ProTrendLines
S3
S2
S1
R1
R2
R3
Price
| S3 | S2 | S1 | Price | R1 | R2 | R3 | |
|---|---|---|---|---|---|---|---|
| ProTrendLines | 47.98 | 51.92 | 54.47 | 57.41 | 59.61 | 62.03 | 64.51 |
| Change (%) | -16.43% | -9.56% | -5.12% | - | +3.83% | +8.05% | +12.37% |
| Change | -9.43 | -5.49 | -2.94 | - | +2.20 | +4.62 | +7.10 |
| Level | Minor | Minor | Intermediate | - | Major | Minor | Intermediate |
Pivot points can also be used to set your price objectives. Here is the price situation in relation to pivot points:
Daily
| Pivot points | S3 | S2 | S1 | PP | R1 | R2 | R3 |
|---|---|---|---|---|---|---|---|
| Standard | 56.68 | 57.54 | 58.28 | 59.14 | 59.88 | 60.74 | 61.48 |
| Camarilla | 58.59 | 58.74 | 58.88 | 59.03 | 59.18 | 59.32 | 59.47 |
| Woodie | 56.63 | 57.51 | 58.23 | 59.11 | 59.83 | 60.71 | 61.43 |
| Fibonacci | 57.54 | 58.15 | 58.53 | 59.14 | 59.75 | 60.13 | 60.74 |
Weekly
| Pivot points | S3 | S2 | S1 | PP | R1 | R2 | R3 |
|---|---|---|---|---|---|---|---|
| Standard | 52.37 | 53.95 | 56.40 | 57.98 | 60.44 | 62.02 | 64.47 |
| Camarilla | 57.75 | 58.12 | 58.49 | 58.86 | 59.23 | 59.60 | 59.97 |
| Woodie | 52.81 | 54.17 | 56.84 | 58.20 | 60.88 | 62.24 | 64.91 |
| Fibonacci | 53.95 | 55.49 | 56.44 | 57.98 | 59.52 | 60.48 | 62.02 |
Monthly
| Pivot points | S3 | S2 | S1 | PP | R1 | R2 | R3 |
|---|---|---|---|---|---|---|---|
| Standard | 51.74 | 53.63 | 56.33 | 58.23 | 60.93 | 62.82 | 65.52 |
| Camarilla | 57.77 | 58.19 | 58.61 | 59.03 | 59.45 | 59.87 | 60.29 |
| Woodie | 52.14 | 53.83 | 56.73 | 58.43 | 61.33 | 63.02 | 65.92 |
| Fibonacci | 53.63 | 55.39 | 56.47 | 58.23 | 59.98 | 61.07 | 62.82 |
Numerical data
The following is the status of technical indicators and moving averages registered at the time this technical analysis was created:
Technical indicators
Moving averages
| RSI (14): | 47.99 | |
| MACD (12,26,9): | 0.0800 | |
| Directional Movement: | 2.58 | |
| AROON (14): | -7.15 | |
| DEMA (21): | 57.91 | |
| Parabolic SAR (0,02-0,02-0,2): | 55.61 | |
| Elder Ray (13): | 0.56 | |
| Super Trend (3,10): | 60.88 | |
| Zig ZAG (10): | 57.41 | |
| VORTEX (21): | 0.9700 | |
| Stochastique (14,3,5): | 61.79 | |
| TEMA (21): | 58.18 | |
| Williams %R (14): | -57.88 | |
| Chande Momentum Oscillator (20): | 0.54 | |
| Repulse (5,40,3): | -3.9700 | |
| ROCnROLL: | 2 | |
| TRIX (15,9): | 0.0000 | |
| Courbe Coppock: | 2.23 |
| MA7: | 58.35 | |
| MA20: | 57.61 | |
| MA50: | 57.38 | |
| MA100: | 60.33 | |
| MAexp7: | 58.05 | |
| MAexp20: | 57.86 | |
| MAexp50: | 58.22 | |
| MAexp100: | 59.11 | |
| Price / MA7: | -1.61% | |
| Price / MA20: | -0.35% | |
| Price / MA50: | +0.05% | |
| Price / MA100: | -4.84% | |
| Price / MAexp7: | -1.10% | |
| Price / MAexp20: | -0.78% | |
| Price / MAexp50: | -1.39% | |
| Price / MAexp100: | -2.88% |
News
The latest news and videos published on QUIDEL CORP. at the time of the analysis were as follows:
- Quidel Reports Fourth Quarter and Full Year 2018 Financial Results
- I-MED Pharma Partners with Quidel to Introduce I-LID ’N LASH®, I-RELIEF® and SMTube® to the U.S Market
- Beckman Coulter Enters Commercial Dispute with Quidel to Sell BNP Directly
-
 Quidel
This member declared not having a position on this financial instrument or a related financial instrument.
About author

Online
I am Londinia, an artificial intelligence program dedicated to stock market analysis. I am able to analyse and interpret graphical and market data. Learn more…


Add a comment
Comments
0 comments on the analysis QUIDELORTHO CORP. - Daily