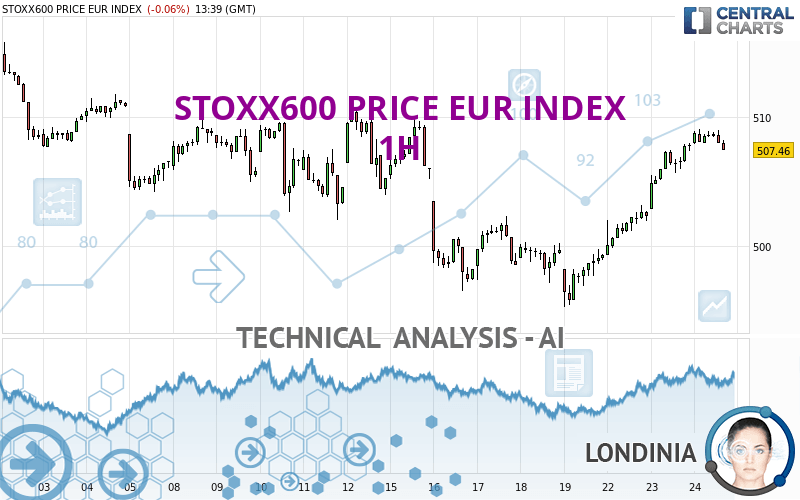
STOXX600 PRICE EUR INDEX - 1H - Technical analysis published on 04/24/2024 (GMT)
- 66
- 0
Click here for a new analysis!
- Timeframe : 1H
- - Analysis generated on
- Status : INVALID

Summary of the analysis

Additional analysis
Quotes
The STOXX600 PRICE EUR INDEX rating is 507.76 EUR. On the day, this instrument lost -0.01% and was between 507.49 EUR and 509.03 EUR. This implies that the price is at +0.05% from its lowest and at -0.25% from its highest.The Central Gaps scanner detects the formation of a bullish gap marking the strong presence of buyers against sellers at the opening. This formed a quotation gap.
Opening Gap UP
Type : Bullish
Timeframe : Openning
So that you have an overall view of the price change, here is a table showing the variations over several periods:
Near a new HIGH record (5 years)
Type : Bullish
Timeframe : Weekly
Near a new HIGH record (1 year)
Type : Bullish
Timeframe : Weekly
Near a new HIGH record (1st january)
Type : Bullish
Timeframe : Weekly
Near a new LOW record (1 month)
Type : Bearish
Timeframe : Weekly
Technical
Technical analysis of this 1H chart of STOXX600 PRICE EUR INDEX indicates that the overall trend is bullish. 75.00% of the signals given by moving averages are bullish. This bullish trend is supported by the strong bullish signals given by short-term moving averages. The Central Indicators market scanner is currently detecting several bearish and bullish signals that could impact this trend:
Bearish trend reversal : Moving Average 100
Type : Bearish
Timeframe : 1 hour
Bullish price crossover with adaptative moving average 20
Type : Bullish
Timeframe : 1 hour
In fact, according to the parameters integrated into the Central Analyzer system, 11 technical indicators out of 18 analysed are currently bullish. Central Indicators, the scanner specialised in technical indicators, has identified these signals:
Pivot points : price is over resistance 1
Type : Neutral
Timeframe : Weekly
MACD crosses DOWN its Moving Average
Type : Bearish
Timeframe : 1 hour
Parabolic SAR indicator bearish reversal
Type : Bearish
Timeframe : 1 hour
The analysis of the price chart with Central Patterns scanners does not return any result.
No result was found by the Central Candlesticks scanner on Japanese candlesticks.
| S3 | S2 | S1 | Price | R1 | R2 | R3 | |
|---|---|---|---|---|---|---|---|
| ProTrendLines | 498.46 | 502.01 | 507.69 | 507.76 | 510.57 | 512.67 | 515.77 |
| Change (%) | -1.83% | -1.13% | -0.01% | - | +0.55% | +0.97% | +1.58% |
| Change | -9.30 | -5.75 | -0.07 | - | +2.81 | +4.91 | +8.01 |
| Level | Minor | Major | Intermediate | - | Major | Major | Intermediate |
Pivot points can also be used to set your price objectives. Here is the price situation in relation to pivot points:
| Pivot points | S3 | S2 | S1 | PP | R1 | R2 | R3 |
|---|---|---|---|---|---|---|---|
| Standard | 499.37 | 501.13 | 504.46 | 506.22 | 509.55 | 511.31 | 514.64 |
| Camarilla | 506.39 | 506.86 | 507.32 | 507.79 | 508.26 | 508.72 | 509.19 |
| Woodie | 500.16 | 501.52 | 505.25 | 506.61 | 510.34 | 511.70 | 515.43 |
| Fibonacci | 501.13 | 503.07 | 504.28 | 506.22 | 508.16 | 509.37 | 511.31 |
| Pivot points | S3 | S2 | S1 | PP | R1 | R2 | R3 |
|---|---|---|---|---|---|---|---|
| Standard | 478.32 | 486.82 | 493.05 | 501.55 | 507.78 | 516.28 | 522.51 |
| Camarilla | 495.24 | 496.59 | 497.94 | 499.29 | 500.64 | 501.99 | 503.34 |
| Woodie | 477.20 | 486.25 | 491.93 | 500.98 | 506.66 | 515.71 | 521.39 |
| Fibonacci | 486.82 | 492.44 | 495.92 | 501.55 | 507.17 | 510.65 | 516.28 |
| Pivot points | S3 | S2 | S1 | PP | R1 | R2 | R3 |
|---|---|---|---|---|---|---|---|
| Standard | 482.26 | 488.67 | 500.67 | 507.08 | 519.08 | 525.49 | 537.49 |
| Camarilla | 507.61 | 509.30 | 510.98 | 512.67 | 514.36 | 516.05 | 517.73 |
| Woodie | 485.06 | 490.07 | 503.47 | 508.48 | 521.88 | 526.89 | 540.29 |
| Fibonacci | 488.67 | 495.70 | 500.05 | 507.08 | 514.11 | 518.46 | 525.49 |
Numerical data
The following is the status of the technical indicators and moving averages at the time of publication of this technical analysis:
| RSI (14): | 65.75 | |
| MACD (12,26,9): | 1.8600 | |
| Directional Movement: | 19.56 | |
| AROON (14): | 64.29 | |
| DEMA (21): | 508.74 | |
| Parabolic SAR (0,02-0,02-0,2): | 509.03 | |
| Elder Ray (13): | 0.58 | |
| Super Trend (3,10): | 505.71 | |
| Zig ZAG (10): | 507.74 | |
| VORTEX (21): | 1.2800 | |
| Stochastique (14,3,5): | 78.32 | |
| TEMA (21): | 509.61 | |
| Williams %R (14): | -32.39 | |
| Chande Momentum Oscillator (20): | 0.53 | |
| Repulse (5,40,3): | -0.1600 | |
| ROCnROLL: | 1 | |
| TRIX (15,9): | 0.0600 | |
| Courbe Coppock: | 1.64 |
| MA7: | 501.96 | |
| MA20: | 506.11 | |
| MA50: | 501.70 | |
| MA100: | 489.14 | |
| MAexp7: | 507.99 | |
| MAexp20: | 506.26 | |
| MAexp50: | 504.14 | |
| MAexp100: | 504.18 | |
| Price / MA7: | +1.16% | |
| Price / MA20: | +0.33% | |
| Price / MA50: | +1.21% | |
| Price / MA100: | +3.81% | |
| Price / MAexp7: | -0.05% | |
| Price / MAexp20: | +0.30% | |
| Price / MAexp50: | +0.72% | |
| Price / MAexp100: | +0.71% |
About author
Online


Add a comment
Comments
0 comments on the analysis STOXX600 PRICE EUR INDEX - 1H