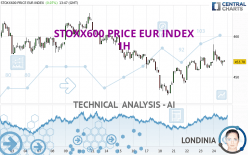
STOXX600 PRICE EUR INDEX - 1H - Technical analysis published on 08/24/2023 (GMT)
- 118
- 0
Click here for a new analysis!
- Timeframe : 1H
- - Analysis generated on
- Status : TARGET REACHED

Summary of the analysis

Additional analysis
Quotes
The STOXX600 PRICE EUR INDEX price is 453.35 EUR. On the day, this instrument lost -0.02% and was between 452.78 EUR and 458.02 EUR. This implies that the price is at +0.13% from its lowest and at -1.02% from its highest.The Central Gaps scanner detects a bullish opening marking the presence of buyers ahead of sellers at the opening but not sufficiently marked to allow the price to register a quotation gap.
Bullish opening
Type : Bullish
Timeframe : Openning
A study of price movements over other periods shows the following variations:
Near a new HIGH record (1 year)
Type : Bullish
Timeframe : Weekly
Near a new HIGH record (1st january)
Type : Bullish
Timeframe : Weekly
Near a new HIGH record (1 month)
Type : Bullish
Timeframe : Weekly
Technical
A technical analysis in 1H of this STOXX600 PRICE EUR INDEX chart shows a bearish trend. The signals given by moving averages are 75.00% bearish. This bearish trend could slow down given the neutral signals currently being given by short-term moving averages. The Central Indicators market scanner is currently detecting several bearish signals that could impact this trend:
Bearish trend reversal : Moving Average 50
Type : Bearish
Timeframe : 1 hour
Bearish trend reversal : adaptative moving average 20
Type : Bearish
Timeframe : 1 hour
In fact, Central Analyzer took into account 18 technical indicators and the result was as follows: 4 are bullish, 7 are neutral and 7 are bearish. But beware of excesses. The Central Indicators scanner currently detects this:
Williams %R indicator is oversold : under -80
Type : Neutral
Timeframe : 1 hour
RSI indicator is back under 50
Type : Bearish
Timeframe : 1 hour
Price is back over the pivot point
Type : Bullish
Timeframe : Weekly
Price is back under the pivot point
Type : Bearish
Timeframe : 1 hour
Momentum indicator is back over 0
Type : Bullish
Timeframe : 1 hour
No signals are given by Central Patterns, a market scanner specialised in chart patterns, resistances and supports.
No result was found by the Central Candlesticks scanner on Japanese candlesticks.
| S3 | S2 | S1 | Price | R1 | R2 | R3 | |
|---|---|---|---|---|---|---|---|
| ProTrendLines | 435.36 | 447.21 | 451.79 | 453.35 | 455.63 | 457.76 | 460.02 |
| Change (%) | -3.97% | -1.35% | -0.34% | - | +0.50% | +0.97% | +1.47% |
| Change | -17.99 | -6.14 | -1.56 | - | +2.28 | +4.41 | +6.67 |
| Level | Major | Major | Major | - | Intermediate | Intermediate | Minor |
Pivot points can also be used to set your price objectives. Here is the price situation in relation to pivot points:
| Pivot points | S3 | S2 | S1 | PP | R1 | R2 | R3 |
|---|---|---|---|---|---|---|---|
| Standard | 448.81 | 450.40 | 451.92 | 453.51 | 455.03 | 456.62 | 458.14 |
| Camarilla | 452.60 | 452.88 | 453.17 | 453.45 | 453.74 | 454.02 | 454.31 |
| Woodie | 448.79 | 450.38 | 451.90 | 453.49 | 455.01 | 456.60 | 458.12 |
| Fibonacci | 450.40 | 451.59 | 452.32 | 453.51 | 454.70 | 455.43 | 456.62 |
| Pivot points | S3 | S2 | S1 | PP | R1 | R2 | R3 |
|---|---|---|---|---|---|---|---|
| Standard | 427.45 | 436.47 | 442.46 | 451.48 | 457.47 | 466.49 | 472.48 |
| Camarilla | 444.31 | 445.69 | 447.06 | 448.44 | 449.82 | 451.19 | 452.57 |
| Woodie | 425.93 | 435.71 | 440.94 | 450.72 | 455.95 | 465.73 | 470.96 |
| Fibonacci | 436.47 | 442.21 | 445.75 | 451.48 | 457.22 | 460.76 | 466.49 |
| Pivot points | S3 | S2 | S1 | PP | R1 | R2 | R3 |
|---|---|---|---|---|---|---|---|
| Standard | 425.50 | 435.20 | 453.28 | 462.98 | 481.06 | 490.76 | 508.84 |
| Camarilla | 463.71 | 466.26 | 468.80 | 471.35 | 473.90 | 476.44 | 478.99 |
| Woodie | 429.68 | 437.30 | 457.46 | 465.08 | 485.24 | 492.86 | 513.02 |
| Fibonacci | 435.20 | 445.82 | 452.37 | 462.98 | 473.60 | 480.15 | 490.76 |
Numerical data
The following is the status of the technical indicators and moving averages at the time of publication of this technical analysis:
| RSI (14): | 48.04 | |
| MACD (12,26,9): | 0.4600 | |
| Directional Movement: | 6.91 | |
| AROON (14): | 28.57 | |
| DEMA (21): | 454.30 | |
| Parabolic SAR (0,02-0,02-0,2): | 452.82 | |
| Elder Ray (13): | -0.49 | |
| Super Trend (3,10): | 451.84 | |
| Zig ZAG (10): | 453.12 | |
| VORTEX (21): | 0.9300 | |
| Stochastique (14,3,5): | 24.59 | |
| TEMA (21): | 454.55 | |
| Williams %R (14): | -84.67 | |
| Chande Momentum Oscillator (20): | 0.03 | |
| Repulse (5,40,3): | -0.3600 | |
| ROCnROLL: | 2 | |
| TRIX (15,9): | 0.0200 | |
| Courbe Coppock: | 0.28 |
| MA7: | 451.69 | |
| MA20: | 458.33 | |
| MA50: | 458.73 | |
| MA100: | 460.93 | |
| MAexp7: | 453.94 | |
| MAexp20: | 453.63 | |
| MAexp50: | 453.40 | |
| MAexp100: | 454.82 | |
| Price / MA7: | +0.37% | |
| Price / MA20: | -1.09% | |
| Price / MA50: | -1.17% | |
| Price / MA100: | -1.64% | |
| Price / MAexp7: | -0.13% | |
| Price / MAexp20: | -0.06% | |
| Price / MAexp50: | -0.01% | |
| Price / MAexp100: | -0.32% |
About author
Online


Add a comment
Comments
0 comments on the analysis STOXX600 PRICE EUR INDEX - 1H