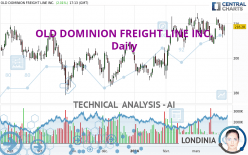
OLD DOMINION FREIGHT LINE INC. - Daily - Technical analysis published on 03/28/2024 (GMT)
- 93
- 0
Click here for a new analysis!
- Timeframe : Daily
- - Analysis generated on
- Status : INVALID

Summary of the analysis

Additional analysis
Quotes
OLD DOMINION FREIGHT LINE INC. rating 218.28 USD. On the day, this instrument gained +2.01% with the lowest point at 213.21 USD and the highest point at 219.25 USD. The deviation from the price is +2.38% for the low point and -0.44% for the high point.A bullish opening was detected by the Central Gaps scanner. Buyers are trying to impose a bullish momentum in the very short term.
Bullish opening
Type : Bullish
Timeframe : Openning
A study of price movements over other periods shows the following variations:
Near a new HIGH record (5 years)
Type : Bullish
Timeframe : Weekly
Near a new HIGH record (1 year)
Type : Bullish
Timeframe : Weekly
Near a new HIGH record (1st january)
Type : Bullish
Timeframe : Weekly
Near a new HIGH record (1 month)
Type : Bullish
Timeframe : Weekly
Technical
Technical analysis of this Daily chart of OLD DOMINION FREIGHT LINE INC. indicates that the overall trend is strongly bullish. 89.29% of the signals given by moving averages are bullish. The slightly bullish signals given by the short-term moving averages indicate this trend is showing signs of running out of steam. The Central Indicators scanner detects bullish signals on moving averages that could impact this trend:
Bullish price crossover with Moving Average 20
Type : Bullish
Timeframe : Daily
Bullish price crossover with adaptative moving average 20
Type : Bullish
Timeframe : Daily
The probability of a further increase is slight given the direction of the technical indicators.
Central Indicators, the scanner specialised in technical indicators, has identified these signals:
Pivot points : price is over resistance 1
Type : Neutral
Timeframe : Daily
RSI indicator is back over 50
Type : Bullish
Timeframe : Daily
Williams %R indicator is back over -50
Type : Bullish
Timeframe : Daily
Central Patterns, the scanner specializing in chart patterns, did not identify any signals.
For a small rebound in the very short term, the Central Candlesticks scanner currently notes the presence of this bullish pattern in Japanese candlesticks:
Bullish harami
Type : Bullish
Timeframe : Daily
| S3 | S2 | S1 | Price | R1 | |
|---|---|---|---|---|---|
| ProTrendLines | 202.25 | 207.62 | 217.27 | 218.28 | 222.82 |
| Change (%) | -7.34% | -4.88% | -0.46% | - | +2.08% |
| Change | -16.03 | -10.66 | -1.01 | - | +4.54 |
| Level | Minor | Major | Major | - | Major |
Attention could also be paid to pivot points to set price objectives:
| Pivot points | S3 | S2 | S1 | PP | R1 | R2 | R3 |
|---|---|---|---|---|---|---|---|
| Standard | 202.91 | 207.39 | 210.69 | 215.17 | 218.47 | 222.95 | 226.25 |
| Camarilla | 211.84 | 212.55 | 213.27 | 213.98 | 214.69 | 215.41 | 216.12 |
| Woodie | 202.31 | 207.10 | 210.09 | 214.88 | 217.87 | 222.66 | 225.65 |
| Fibonacci | 207.39 | 210.37 | 212.20 | 215.17 | 218.15 | 219.98 | 222.95 |
| Pivot points | S3 | S2 | S1 | PP | R1 | R2 | R3 |
|---|---|---|---|---|---|---|---|
| Standard | 196.09 | 202.21 | 211.37 | 217.49 | 226.65 | 232.77 | 241.93 |
| Camarilla | 216.34 | 217.74 | 219.14 | 220.54 | 221.94 | 223.34 | 224.74 |
| Woodie | 197.62 | 202.97 | 212.90 | 218.25 | 228.18 | 233.53 | 243.46 |
| Fibonacci | 202.21 | 208.04 | 211.65 | 217.49 | 223.32 | 226.93 | 232.77 |
| Pivot points | S3 | S2 | S1 | PP | R1 | R2 | R3 |
|---|---|---|---|---|---|---|---|
| Standard | 161.82 | 174.85 | 197.91 | 210.94 | 234.00 | 247.03 | 270.09 |
| Camarilla | 211.06 | 214.36 | 217.67 | 220.98 | 224.29 | 227.60 | 230.91 |
| Woodie | 166.85 | 177.36 | 202.94 | 213.45 | 239.03 | 249.54 | 275.12 |
| Fibonacci | 174.85 | 188.63 | 197.15 | 210.94 | 224.72 | 233.24 | 247.03 |
Numerical data
The following are the details of the technical indicators and moving averages that were collected to generate this technical analysis:
| RSI (14): | 53.59 | |
| MACD (12,26,9): | 1.1400 | |
| Directional Movement: | -1.35 | |
| AROON (14): | 14.29 | |
| DEMA (21): | 218.14 | |
| Parabolic SAR (0,02-0,02-0,2): | 209.79 | |
| Elder Ray (13): | -0.48 | |
| Super Trend (3,10): | 208.55 | |
| Zig ZAG (10): | 218.50 | |
| VORTEX (21): | 0.9300 | |
| Stochastique (14,3,5): | 52.71 | |
| TEMA (21): | 216.71 | |
| Williams %R (14): | -33.41 | |
| Chande Momentum Oscillator (20): | -2.02 | |
| Repulse (5,40,3): | -0.2800 | |
| ROCnROLL: | 1 | |
| TRIX (15,9): | 0.1000 | |
| Courbe Coppock: | 1.20 |
| MA7: | 218.11 | |
| MA20: | 216.95 | |
| MA50: | 211.60 | |
| MA100: | 204.13 | |
| MAexp7: | 216.94 | |
| MAexp20: | 216.26 | |
| MAexp50: | 212.23 | |
| MAexp100: | 206.55 | |
| Price / MA7: | +0.08% | |
| Price / MA20: | +0.61% | |
| Price / MA50: | +3.16% | |
| Price / MA100: | +6.93% | |
| Price / MAexp7: | +0.62% | |
| Price / MAexp20: | +0.93% | |
| Price / MAexp50: | +2.85% | |
| Price / MAexp100: | +5.68% |
News
The latest news and videos published on OLD DOMINION FREIGHT LINE INC. at the time of the analysis were as follows:
- Old Dominion Freight Line Reports Second Quarter 2023 Earnings Per Diluted Share of $2.65
- Old Dominion Freight Line Announces $0.40 Per Share Quarterly Cash Dividend
- Old Dominion Freight Line Releases 2022 ESG Report
- Old Dominion Freight Line to Webcast Second Quarter 2023 Conference Call
- Old Dominion Freight Line Provides Update for Second Quarter 2023
About author
Online


Add a comment
Comments
0 comments on the analysis OLD DOMINION FREIGHT LINE INC. - Daily