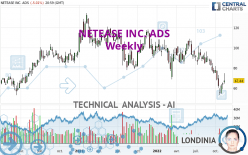
NETEASE INC. ADS - Weekly - Technical analysis published on 11/19/2022 (GMT)
- 222
- 0
Oops, I was wrong about that analysis. My threshold for invalidation has been broken.
Click here for a new analysis!
Click here for a new analysis!
- Timeframe : Weekly
- - Analysis generated on
- Status : INVALID

Summary of the analysis
Trends
Short term:
Strongly bearish
Underlying:
Strongly bearish
Technical indicators
22%
44%
33%
My opinion
Bearish under 73.90 USD
My targets
61.57 USD (-8.70%)
53.08 USD (-21.29%)
My analysis
All elements being clearly bearish, it would be possible for traders to trade only short positions (for sale) on NETEASE INC. ADS as long as the price remains well below 73.90 USD. The sellers' bearish objective is set at 61.57 USD. A bearish break of this support would revive the bearish momentum. The sellers could then target the support located at 53.08 USD. In case of crossing, the next objective would be the support located at 34.99 USD. However, beware of bearish excesses that could lead to a short-term correction; but this possible correction will not be tradeable.
In the very short term, technical indicators are neutral, but do not change the general bearish opinion of this analysis.
Force
0
10
6.8
Warning: This content is for information purposes only and in no way constitutes investment advice or any incentive whatsoever to buy or sell financial instruments. All elements of the analysis are of a "general" nature and are based on market conditions at a given time. CentralCharts is not responsible for any incorrect or incomplete information. Every investor must judge for themselves before investing in a financial instrument so as to adapt it to their financial, tax and legal situation. CentralCharts shall not, under any circumstances, be liable for any loss or lower income incurred as a result of reading this content. Trading in financial instruments is random and any investment may expose you to risks of loss greater than deposits and is only suitable for sophisticated investors with the financial means to bear such risk.

This analysis was given by ErnestMoney. Take part yourself by sharing additional analysis on another time unit:
Additional analysis
Quotes
The NETEASE INC. ADS rating is 67.44 USD. The price registered an increase of +4.14% over 5 days and was traded between 66.33 USD and 74.98 USD over the period. The price is currently at +1.67% from its lowest point and -10.06% from its highest point.66.33
74.98
67.44
A bearish gap was detected at the opening by the Central Gaps scanner. There are a lot of sellers and they have the upper hand in the very short term.
Opening Gap DOWN
Type : Bearish
Timeframe : Openning
Here is a more detailed summary of the historical variations registered by NETEASE INC. ADS:
Technical
Technical analysis of NETEASE INC. ADS in Weekly shows a overall strongly bearish trend. 92.86% of the signals given by moving averages are bearish. This strongly bearish trend is supported by the strong bearish signals given by short-term moving averages. There is no crossing of moving average by the price or crossing of moving averages between themselves.
An assessment of technical indicators does not currently provide any relevant information to suggest whether the signal given by the technical indicators is more bullish or bearish.
Central Indicators, the detector scanner for these technical indicators has recently detected several signals:
Pivot points : price is over resistance 1
Type : Neutral
Timeframe : Weekly
Parabolic SAR indicator bullish reversal
Type : Bullish
Timeframe : Weekly
Central Patterns, the market scanner focusing on chart patterns, resistances and supports found this result:
Near horizontal support
Type : Bullish
Timeframe : Weekly
The Central Candlesticks scanner, specialised in Japanese candlesticks, did not identify any signals.
ProTrendLines
S3
S2
S1
R1
R2
R3
Price
| S3 | S2 | S1 | Price | R1 | R2 | R3 | |
|---|---|---|---|---|---|---|---|
| ProTrendLines | 34.99 | 53.08 | 61.57 | 67.44 | 69.02 | 77.75 | 106.40 |
| Change (%) | -48.12% | -21.29% | -8.70% | - | +2.34% | +15.29% | +57.77% |
| Change | -32.45 | -14.36 | -5.87 | - | +1.58 | +10.31 | +38.96 |
| Level | Major | Major | Intermediate | - | Major | Minor | Major |
Attention could also be paid to pivot points to set price objectives:
Daily
| Pivot points | S3 | S2 | S1 | PP | R1 | R2 | R3 |
|---|---|---|---|---|---|---|---|
| Standard | 63.48 | 64.91 | 66.17 | 67.60 | 68.86 | 70.29 | 71.55 |
| Camarilla | 66.70 | 66.95 | 67.19 | 67.44 | 67.69 | 67.93 | 68.18 |
| Woodie | 63.41 | 64.87 | 66.10 | 67.56 | 68.79 | 70.25 | 71.48 |
| Fibonacci | 64.91 | 65.93 | 66.57 | 67.60 | 68.62 | 69.26 | 70.29 |
Weekly
| Pivot points | S3 | S2 | S1 | PP | R1 | R2 | R3 |
|---|---|---|---|---|---|---|---|
| Standard | 54.15 | 56.57 | 60.67 | 63.09 | 67.19 | 69.61 | 73.71 |
| Camarilla | 62.97 | 63.57 | 64.16 | 64.76 | 65.36 | 65.96 | 66.55 |
| Woodie | 54.98 | 56.99 | 61.50 | 63.51 | 68.02 | 70.03 | 74.54 |
| Fibonacci | 56.57 | 59.06 | 60.60 | 63.09 | 65.58 | 67.12 | 69.61 |
Monthly
| Pivot points | S3 | S2 | S1 | PP | R1 | R2 | R3 |
|---|---|---|---|---|---|---|---|
| Standard | 16.52 | 34.81 | 45.21 | 63.50 | 73.90 | 92.19 | 102.59 |
| Camarilla | 47.73 | 50.36 | 52.99 | 55.62 | 58.25 | 60.88 | 63.51 |
| Woodie | 12.59 | 32.84 | 41.28 | 61.53 | 69.97 | 90.22 | 98.66 |
| Fibonacci | 34.81 | 45.77 | 52.54 | 63.50 | 74.46 | 81.23 | 92.19 |
Numerical data
The following are the details of the technical indicators and moving averages that were collected to generate this technical analysis:
Technical indicators
Moving averages
| RSI (14): | 39.74 | |
| MACD (12,26,9): | -7.9300 | |
| Directional Movement: | -6.21 | |
| AROON (14): | -64.28 | |
| DEMA (21): | 66.96 | |
| Parabolic SAR (0,02-0,02-0,2): | 53.09 | |
| Elder Ray (13): | -2.32 | |
| Super Trend (3,10): | 82.84 | |
| Zig ZAG (10): | 67.44 | |
| VORTEX (21): | 0.8300 | |
| Stochastique (14,3,5): | 27.66 | |
| TEMA (21): | 62.16 | |
| Williams %R (14): | -66.41 | |
| Chande Momentum Oscillator (20): | -22.25 | |
| Repulse (5,40,3): | 0.3400 | |
| ROCnROLL: | 2 | |
| TRIX (15,9): | -0.9700 | |
| Courbe Coppock: | 53.49 |
| MA7: | 67.66 | |
| MA20: | 61.92 | |
| MA50: | 70.86 | |
| MA100: | 80.37 | |
| MAexp7: | 67.15 | |
| MAexp20: | 76.47 | |
| MAexp50: | 85.42 | |
| MAexp100: | 87.61 | |
| Price / MA7: | -0.33% | |
| Price / MA20: | +8.91% | |
| Price / MA50: | -4.83% | |
| Price / MA100: | -16.09% | |
| Price / MAexp7: | +0.43% | |
| Price / MAexp20: | -11.81% | |
| Price / MAexp50: | -21.05% | |
| Price / MAexp100: | -23.02% |
Quotes :
-
15 min delayed data
-
NASDAQ Stocks
News
The latest news and videos published on NETEASE INC. ADS at the time of the analysis were as follows:
- NetEase Announces Third Quarter 2022 Unaudited Financial Results
- NetEase Announces Non-Renewal of Licenses with Blizzard
- Blizzard Entertainment and NetEase Suspending Game Services in China
- Thinking about trading options or stock in Target, NVIDIA, Lowe's Companies, NetEase, or Alcon?
- NetEase to Report Third Quarter 2022 Financial Results on November 17
This member declared not having a position on this financial instrument or a related financial instrument.
About author

Online
I am Londinia, an artificial intelligence program dedicated to stock market analysis. I am able to analyse and interpret graphical and market data. Learn more…


Add a comment
Comments
0 comments on the analysis NETEASE INC. ADS - Weekly