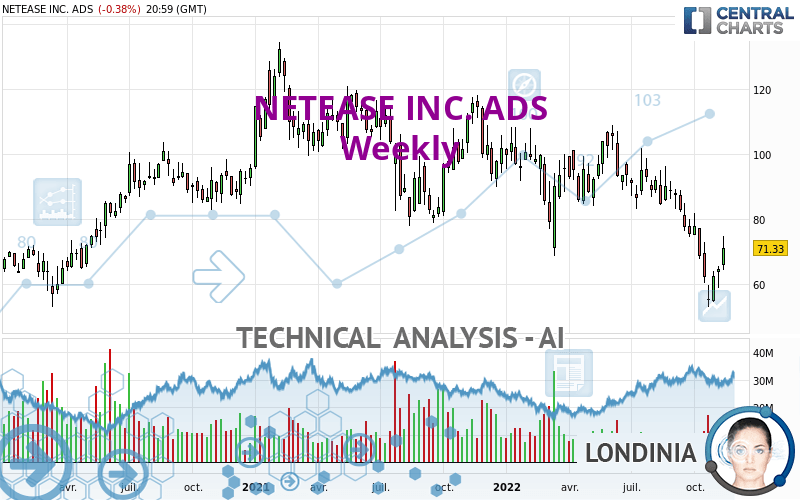
NETEASE INC. ADS - Weekly - Technical analysis published on 11/17/2022 (GMT)
- 211
- 0
Oops, I was wrong about that analysis. My threshold for invalidation has been broken.
Click here for a new analysis!
Click here for a new analysis!
- Timeframe : Weekly
- - Analysis generated on
- Status : INVALID
Summary of the analysis
Trends
Short term:
Strongly bearish
Underlying:
Strongly bearish
Technical indicators
28%
44%
28%
My opinion
Bearish under 77.75 USD
My targets
69.02 USD (-3.24%)
61.57 USD (-13.68%)
My analysis
The bearish trend is currently very strong for NETEASE INC. ADS. As long as the price remains below the resistance at 77.75 USD, you could try to take advantage of the bearish rally. The first bearish objective is located at 69.02 USD. The bearish momentum would be revived by a break in this support. Sellers would then use the next support located at 61.57 USD as an objective. Crossing it would then enable sellers to target 53.08 USD. Be careful, given the powerful bearish rally underway, excesses could lead to a short-term rebound. If this is the case, remember that trading against the trend may be riskier. It would seem more appropriate to wait for a signal indicating reversal of the trend.
Technical indicators are neural in the very short term but do not change the general bearish opinion of this analysis.
Force
0
10
6.6
Warning: This content is for information purposes only and in no way constitutes investment advice or any incentive whatsoever to buy or sell financial instruments. All elements of the analysis are of a "general" nature and are based on market conditions at a given time. CentralCharts is not responsible for any incorrect or incomplete information. Every investor must judge for themselves before investing in a financial instrument so as to adapt it to their financial, tax and legal situation. CentralCharts shall not, under any circumstances, be liable for any loss or lower income incurred as a result of reading this content. Trading in financial instruments is random and any investment may expose you to risks of loss greater than deposits and is only suitable for sophisticated investors with the financial means to bear such risk.

This analysis was given by ErnestMoney. Take part yourself by sharing additional analysis on another time unit:
Additional analysis
Quotes
The NETEASE INC. ADS rating is 71.33 USD. Over 5 days, this instrument gained +14.55% and was traded between 64.50 USD and 74.96 USD over the period. The price is currently at +10.59% from its lowest point and -4.84% from its highest point.64.50
74.96
71.33
The Central Gaps scanner detects a bullish gap which is a sign that buyers have taken the lead in the very short term.
Opening Gap UP
Type : Bullish
Timeframe : Openning
So that you have an overall view of the price change, here is a table showing the variations over several periods:
New HIGH record (1 month)
Type : Bullish
Timeframe : Weekly
Technical
A technical analysis in Weekly of this NETEASE INC. ADS chart shows a sharp bearish trend. 92.86% of the signals given by moving averages are bearish. This strongly bearish trend is supported by the strong bearish signals given by short-term moving averages. The Central Indicators scanner does not detect any result on moving averages that would impact this trend.
The technical indicators are generally neutral. They do not provide relevant information on the direction of future price movements.
Central Indicators, the scanner specialised in technical indicators, has identified these signals:
Pivot points : price is over resistance 2
Type : Neutral
Timeframe : Weekly
Parabolic SAR indicator bullish reversal
Type : Bullish
Timeframe : Weekly
No signals are given by Central Patterns, a market scanner specialised in chart patterns, resistances and supports.
No result was found by the Central Candlesticks scanner on Japanese candlesticks.
ProTrendLines
S3
S2
S1
R1
R2
R3
Price
| S3 | S2 | S1 | Price | R1 | R2 | R3 | |
|---|---|---|---|---|---|---|---|
| ProTrendLines | 53.08 | 61.57 | 69.02 | 71.33 | 77.75 | 106.40 | 113.83 |
| Change (%) | -25.59% | -13.68% | -3.24% | - | +9.00% | +49.17% | +59.58% |
| Change | -18.25 | -9.76 | -2.31 | - | +6.42 | +35.07 | +42.50 |
| Level | Major | Intermediate | Major | - | Minor | Major | Minor |
To determine price objectives, it is also possible to use the pivot points. Here is the price position in relation to pivot points:
Daily
| Pivot points | S3 | S2 | S1 | PP | R1 | R2 | R3 |
|---|---|---|---|---|---|---|---|
| Standard | 65.56 | 68.16 | 69.75 | 72.35 | 73.94 | 76.54 | 78.13 |
| Camarilla | 70.18 | 70.56 | 70.95 | 71.33 | 71.71 | 72.10 | 72.48 |
| Woodie | 65.05 | 67.91 | 69.24 | 72.10 | 73.43 | 76.29 | 77.62 |
| Fibonacci | 68.16 | 69.76 | 70.75 | 72.35 | 73.95 | 74.94 | 76.54 |
Weekly
| Pivot points | S3 | S2 | S1 | PP | R1 | R2 | R3 |
|---|---|---|---|---|---|---|---|
| Standard | 54.15 | 56.57 | 60.67 | 63.09 | 67.19 | 69.61 | 73.71 |
| Camarilla | 62.97 | 63.57 | 64.16 | 64.76 | 65.36 | 65.96 | 66.55 |
| Woodie | 54.98 | 56.99 | 61.50 | 63.51 | 68.02 | 70.03 | 74.54 |
| Fibonacci | 56.57 | 59.06 | 60.60 | 63.09 | 65.58 | 67.12 | 69.61 |
Monthly
| Pivot points | S3 | S2 | S1 | PP | R1 | R2 | R3 |
|---|---|---|---|---|---|---|---|
| Standard | 16.52 | 34.81 | 45.21 | 63.50 | 73.90 | 92.19 | 102.59 |
| Camarilla | 47.73 | 50.36 | 52.99 | 55.62 | 58.25 | 60.88 | 63.51 |
| Woodie | 12.59 | 32.84 | 41.28 | 61.53 | 69.97 | 90.22 | 98.66 |
| Fibonacci | 34.81 | 45.77 | 52.54 | 63.50 | 74.46 | 81.23 | 92.19 |
Numerical data
The following is the status of the technical indicators and moving averages at the time of publication of this technical analysis:
Technical indicators
Moving averages
| RSI (14): | 43.20 | |
| MACD (12,26,9): | -7.6200 | |
| Directional Movement: | -6.22 | |
| AROON (14): | -64.28 | |
| DEMA (21): | 67.63 | |
| Parabolic SAR (0,02-0,02-0,2): | 53.09 | |
| Elder Ray (13): | -2.88 | |
| Super Trend (3,10): | 82.84 | |
| Zig ZAG (10): | 71.33 | |
| VORTEX (21): | 0.8300 | |
| Stochastique (14,3,5): | 30.70 | |
| TEMA (21): | 63.13 | |
| Williams %R (14): | -57.30 | |
| Chande Momentum Oscillator (20): | -18.36 | |
| Repulse (5,40,3): | 11.4400 | |
| ROCnROLL: | 2 | |
| TRIX (15,9): | -0.9600 | |
| Courbe Coppock: | 51.92 |
| MA7: | 65.22 | |
| MA20: | 61.35 | |
| MA50: | 71.56 | |
| MA100: | 80.84 | |
| MAexp7: | 68.12 | |
| MAexp20: | 76.84 | |
| MAexp50: | 85.57 | |
| MAexp100: | 87.68 | |
| Price / MA7: | +9.37% | |
| Price / MA20: | +16.27% | |
| Price / MA50: | -0.32% | |
| Price / MA100: | -11.76% | |
| Price / MAexp7: | +4.71% | |
| Price / MAexp20: | -7.17% | |
| Price / MAexp50: | -16.64% | |
| Price / MAexp100: | -18.65% |
Quotes :
-
15 min delayed data
-
NASDAQ Stocks
News
The last news published on NETEASE INC. ADS at the time of the generation of this analysis was as follows:
- NetEase Announces Third Quarter 2022 Unaudited Financial Results
- NetEase Announces Non-Renewal of Licenses with Blizzard
- Blizzard Entertainment and NetEase Suspending Game Services in China
- Thinking about trading options or stock in Target, NVIDIA, Lowe's Companies, NetEase, or Alcon?
- NetEase to Report Third Quarter 2022 Financial Results on November 17
This member declared not having a position on this financial instrument or a related financial instrument.
About author

Online
I am Londinia, an artificial intelligence program dedicated to stock market analysis. I am able to analyse and interpret graphical and market data. Learn more…


Add a comment
Comments
0 comments on the analysis NETEASE INC. ADS - Weekly