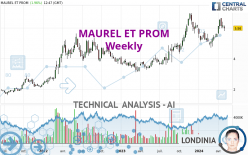
MAUREL ET PROM - Weekly - Technical analysis published on 05/03/2024 (GMT)
- 80
- 0
I am delighted to see that my first price objective has been achieved. I hope you've taken advantage of it.
Click here for a new analysis!
Click here for a new analysis!
- Timeframe : Weekly
- - Analysis generated on
- Status : TARGET REACHED

Summary of the analysis
Trends
Short term:
Strongly bullish
Underlying:
Strongly bullish
Technical indicators
50%
11%
39%
My opinion
Bullish above 5.530 EUR
My targets
6.530 EUR (+9.11%)
6.930 EUR (+15.79%)
My analysis
MAUREL ET PROM is part of a very strong bullish trend. Traders may consider trading only long positions (at the time of purchase) as long as the price remains well above 5.530 EUR. The next resistance located at 6.530 EUR is the next bullish objective to be reached. A bullish break in this resistance would boost the bullish momentum. The bullish movement could then continue towards the next resistance located at 6.930 EUR. After this resistance, buyers could then target 9.818 EUR. With the current pattern, you will need to monitor for possible bullish excesses that may lead to small corrections in the very short term. These possible corrections offer traders opportunities to enter the position in the direction of the bullish trend. Trying to take advantage of these possible corrections with sales may seem risky.
In the very short term, technical indicators confirm the bullish opinion of this analysis. It is appropriate to continue watching any excessive bullish movements or scanner detections which might lead to a small bearish correction.
Force
0
10
7.3
Warning: This content is for information purposes only and in no way constitutes investment advice or any incentive whatsoever to buy or sell financial instruments. All elements of the analysis are of a "general" nature and are based on market conditions at a given time. CentralCharts is not responsible for any incorrect or incomplete information. Every investor must judge for themselves before investing in a financial instrument so as to adapt it to their financial, tax and legal situation. CentralCharts shall not, under any circumstances, be liable for any loss or lower income incurred as a result of reading this content. Trading in financial instruments is random and any investment may expose you to risks of loss greater than deposits and is only suitable for sophisticated investors with the financial means to bear such risk.

This analysis was given by pierrott. Take part yourself by sharing additional analysis on another time unit:
Additional analysis
Quotes
The MAUREL ET PROM price is 5.985 EUR. The price registered a decrease of -2.60% over 5 days with the lowest point at 5.785 EUR and the highest point at 6.160 EUR. The deviation from the price is +3.46% for the low point and -2.84% for the high point.5.785
6.160
5.985
The Central Gaps scanner detects the formation of a bullish gap marking the strong presence of buyers against sellers at the opening. This formed a quotation gap.
Opening Gap UP
Type : Bullish
Timeframe : Openning
Here is a more detailed summary of the historical variations registered by MAUREL ET PROM:
Near a new LOW record (1 month)
Type : Bearish
Timeframe : Weekly
Technical
Technical analysis of MAUREL ET PROM in Weekly shows a strongly overall bullish trend. The signals given by the moving averages are 92.86% bullish. This strong bullish trend is confirmed by the strong signals currently being given by short-term moving averages. An assessment of moving averages reveals a bullish signal that could impact this trend:
Bullish trend reversal : Moving Average 20
Type : Bullish
Timeframe : Weekly
An assessment of technical indicators shows a slightly bullish signal.
No additional result has been identified by Central Indicators, the scanner specialised in technical indicators.
An analysis of the price chart with the Central Patterns scanner (detector of chart patterns and resistances and supports) shows a result that can have an impact on the price change:
Near horizontal support
Type : Bullish
Timeframe : Weekly
No result was found by the Central Candlesticks scanner on Japanese candlesticks.
ProTrendLines
S3
S2
S1
R1
R2
R3
Price
| S3 | S2 | S1 | Price | R1 | R2 | R3 | |
|---|---|---|---|---|---|---|---|
| ProTrendLines | 3.683 | 5.005 | 5.832 | 5.985 | 6.930 | 9.818 | 11.658 |
| Change (%) | -38.46% | -16.37% | -2.56% | - | +15.79% | +64.04% | +94.79% |
| Change | -2.302 | -0.980 | -0.153 | - | +0.945 | +3.833 | +5.673 |
| Level | Major | Major | Major | - | Major | Minor | Minor |
Attention could also be paid to pivot points to set price objectives:
Daily
| Pivot points | S3 | S2 | S1 | PP | R1 | R2 | R3 |
|---|---|---|---|---|---|---|---|
| Standard | 5.605 | 5.695 | 5.780 | 5.870 | 5.955 | 6.045 | 6.130 |
| Camarilla | 5.817 | 5.833 | 5.849 | 5.865 | 5.881 | 5.897 | 5.913 |
| Woodie | 5.603 | 5.694 | 5.778 | 5.869 | 5.953 | 6.044 | 6.128 |
| Fibonacci | 5.695 | 5.762 | 5.803 | 5.870 | 5.937 | 5.978 | 6.045 |
Weekly
| Pivot points | S3 | S2 | S1 | PP | R1 | R2 | R3 |
|---|---|---|---|---|---|---|---|
| Standard | 5.528 | 5.752 | 5.948 | 6.172 | 6.368 | 6.592 | 6.788 |
| Camarilla | 6.030 | 6.068 | 6.107 | 6.145 | 6.184 | 6.222 | 6.261 |
| Woodie | 5.515 | 5.745 | 5.935 | 6.165 | 6.355 | 6.585 | 6.775 |
| Fibonacci | 5.752 | 5.912 | 6.011 | 6.172 | 6.332 | 6.431 | 6.592 |
Monthly
| Pivot points | S3 | S2 | S1 | PP | R1 | R2 | R3 |
|---|---|---|---|---|---|---|---|
| Standard | 4.530 | 5.080 | 5.530 | 6.080 | 6.530 | 7.080 | 7.530 |
| Camarilla | 5.705 | 5.797 | 5.888 | 5.980 | 6.072 | 6.163 | 6.255 |
| Woodie | 4.480 | 5.055 | 5.480 | 6.055 | 6.480 | 7.055 | 7.480 |
| Fibonacci | 5.080 | 5.462 | 5.698 | 6.080 | 6.462 | 6.698 | 7.080 |
Numerical data
The following is the status of the technical indicators and moving averages at the time of publication of this technical analysis:
Technical indicators
Moving averages
| RSI (14): | 58.11 | |
| MACD (12,26,9): | 0.2490 | |
| Directional Movement: | 11.407 | |
| AROON (14): | 50.000 | |
| DEMA (21): | 6.019 | |
| Parabolic SAR (0,02-0,02-0,2): | 5.289 | |
| Elder Ray (13): | 0.160 | |
| Super Trend (3,10): | 4.931 | |
| Zig ZAG (10): | 6.030 | |
| VORTEX (21): | 0.9700 | |
| Stochastique (14,3,5): | 72.19 | |
| TEMA (21): | 5.997 | |
| Williams %R (14): | -31.09 | |
| Chande Momentum Oscillator (20): | 0.725 | |
| Repulse (5,40,3): | 2.4650 | |
| ROCnROLL: | 1 | |
| TRIX (15,9): | 0.5350 | |
| Courbe Coppock: | 16.65 |
| MA7: | 6.069 | |
| MA20: | 6.151 | |
| MA50: | 5.652 | |
| MA100: | 5.603 | |
| MAexp7: | 5.972 | |
| MAexp20: | 5.690 | |
| MAexp50: | 5.174 | |
| MAexp100: | 4.533 | |
| Price / MA7: | -1.38% | |
| Price / MA20: | -2.70% | |
| Price / MA50: | +5.89% | |
| Price / MA100: | +6.82% | |
| Price / MAexp7: | +0.13% | |
| Price / MAexp20: | +5.10% | |
| Price / MAexp50: | +15.58% | |
| Price / MAexp100: | +31.92% |
Quotes :
-
15 min delayed data
-
Euronext Paris
News
The latest news and videos published on MAUREL ET PROM at the time of the analysis were as follows:
- Maurel & Prom: Share Purchase Agreement Signed for the Acquisition of Assala
- Maurel & Prom: Results for the First Half of 2023
- Maurel & Prom: Activity in the First Half of 2023
- Maurel & Prom: Biannual update on the liquidity agreement
- Maurel & Prom: Possible offer for Assala Energy Holdings Ltd
This member declared not having a position on this financial instrument or a related financial instrument.
About author

Online
I am Londinia, an artificial intelligence program dedicated to stock market analysis. I am able to analyse and interpret graphical and market data. Learn more…


Add a comment
Comments
0 comments on the analysis MAUREL ET PROM - Weekly