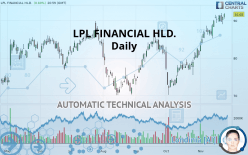
LPL FINANCIAL HLD. - Daily - Technical analysis published on 11/26/2019 (GMT)
- Who voted?
- 218
- 0
Click here for a new analysis!
- Timeframe : Daily
- - Analysis generated on
- Status : LEVEL MAINTAINED

Summary of the analysis

Additional analysis
Quotes
The LPL FINANCIAL HLD. price is 91.65 USD. On the day, this instrument gained +0.83% and was traded between 90.52 USD and 91.99 USD over the period. The price is currently at +1.25% from its lowest and -0.37% from its highest.The Central Gaps scanner detects a bullish opening. A small advantage for buyers in the very short term.
Bullish opening
Type : Bullish
Timeframe : Openning
So that you have an overall view of the price change, here is a table showing the variations over several periods:
Near a new HIGH record (5 years)
Type : Bullish
Timeframe : Weekly
Near a new HIGH record (1 year)
Type : Bullish
Timeframe : Weekly
Near a new HIGH record (1st january)
Type : Bullish
Timeframe : Weekly
Near a new HIGH record (1 month)
Type : Bullish
Timeframe : Weekly
Technical
Technical analysis of this Daily chart of LPL FINANCIAL HLD. indicates that the overall trend is strongly bullish. 92.86% of the signals given by moving averages are bullish. The overall trend is supported by the strong bullish signals from short-term moving averages. There is no crossing of moving average by the price or crossing of moving averages between themselves.
In fact, 13 technical indicators on 18 studied are currently positioned bullish. Caution: the Central Indicators scanner currently detects an excess:
Williams %R indicator is overbought : over -20
Type : Neutral
Timeframe : Daily
Parabolic SAR indicator bearish reversal
Type : Bearish
Timeframe : Daily
Price is back over the pivot point
Type : Bullish
Timeframe : Daily
Price is back over the pivot point
Type : Bullish
Timeframe : Weekly
An analysis of the price chart with the Central Patterns scanner (detector of chart patterns and resistances and supports) shows a result that can have an impact on the price change:
Near resistance of channel
Type : Bearish
Timeframe : Daily
For a small rebound in the very short term, the Central Candlesticks scanner currently notes the presence of this bullish pattern in Japanese candlesticks:
Bullish harami
Type : Bullish
Timeframe : Daily
| S3 | S2 | S1 | Price | |
|---|---|---|---|---|
| ProTrendLines | 77.20 | 84.56 | 87.40 | 91.65 |
| Change (%) | -15.77% | -7.74% | -4.64% | - |
| Change | -14.45 | -7.09 | -4.25 | - |
| Level | Minor | Major | Intermediate | - |
Attention could also be paid to pivot points to set price objectives:
| Pivot points | S3 | S2 | S1 | PP | R1 | R2 | R3 |
|---|---|---|---|---|---|---|---|
| Standard | 87.44 | 88.22 | 89.56 | 90.34 | 91.68 | 92.45 | 93.79 |
| Camarilla | 90.32 | 90.51 | 90.71 | 90.90 | 91.09 | 91.29 | 91.48 |
| Woodie | 87.72 | 88.36 | 89.84 | 90.48 | 91.96 | 92.59 | 94.08 |
| Fibonacci | 88.22 | 89.03 | 89.53 | 90.34 | 91.14 | 91.64 | 92.45 |
| Pivot points | S3 | S2 | S1 | PP | R1 | R2 | R3 |
|---|---|---|---|---|---|---|---|
| Standard | 86.24 | 87.62 | 89.26 | 90.63 | 92.28 | 93.65 | 95.29 |
| Camarilla | 90.07 | 90.35 | 90.62 | 90.90 | 91.18 | 91.45 | 91.73 |
| Woodie | 86.38 | 87.68 | 89.39 | 90.70 | 92.41 | 93.72 | 95.43 |
| Fibonacci | 87.62 | 88.77 | 89.48 | 90.63 | 91.79 | 92.50 | 93.65 |
| Pivot points | S3 | S2 | S1 | PP | R1 | R2 | R3 |
|---|---|---|---|---|---|---|---|
| Standard | 60.09 | 65.12 | 72.98 | 78.00 | 85.86 | 90.89 | 98.75 |
| Camarilla | 77.30 | 78.48 | 79.66 | 80.84 | 82.02 | 83.20 | 84.38 |
| Woodie | 61.51 | 65.83 | 74.40 | 78.71 | 87.28 | 91.60 | 100.17 |
| Fibonacci | 65.12 | 70.04 | 73.08 | 78.00 | 82.92 | 85.97 | 90.89 |
Numerical data
The following is the status of the technical indicators and moving averages at the time of publication of this technical analysis:
| RSI (14): | 71.30 | |
| MACD (12,26,9): | 2.9600 | |
| Directional Movement: | 17.27 | |
| AROON (14): | 42.85 | |
| DEMA (21): | 91.33 | |
| Parabolic SAR (0,02-0,02-0,2): | 92.01 | |
| Elder Ray (13): | 2.17 | |
| Super Trend (3,10): | 85.23 | |
| Zig ZAG (10): | 91.65 | |
| VORTEX (21): | 1.2500 | |
| Stochastique (14,3,5): | 83.31 | |
| TEMA (21): | 92.63 | |
| Williams %R (14): | -5.35 | |
| Chande Momentum Oscillator (20): | 4.28 | |
| Repulse (5,40,3): | 1.8500 | |
| ROCnROLL: | 1 | |
| TRIX (15,9): | 0.5100 | |
| Courbe Coppock: | 15.80 |
| MA7: | 90.76 | |
| MA20: | 87.38 | |
| MA50: | 82.16 | |
| MA100: | 80.67 | |
| MAexp7: | 90.45 | |
| MAexp20: | 87.50 | |
| MAexp50: | 83.64 | |
| MAexp100: | 81.35 | |
| Price / MA7: | +0.98% | |
| Price / MA20: | +4.89% | |
| Price / MA50: | +11.55% | |
| Price / MA100: | +13.61% | |
| Price / MAexp7: | +1.33% | |
| Price / MAexp20: | +4.74% | |
| Price / MAexp50: | +9.58% | |
| Price / MAexp100: | +12.66% |
News
The latest news and videos published on LPL FINANCIAL HLD. at the time of the analysis were as follows:
- Wayne von Borstel Qualifies for LPL Financial's Elite Executive Council
- New Research Coverage Highlights LPL Financial, Under Armour, Washington Prime Group, TRI Pointe Group, Trinity Industries, and Ryder System — Consolidated Revenues, Company Growth, and Expectations for 2018
- AdvisoryWorld Acquired by LPL Financial
- Ward Keever Recognized As One Of LPL Financial's Top Financial Advisors
- Craig Smith Honored As A Top Advisor By LPL Financial
About author

Online


Add a comment
Comments
0 comments on the analysis LPL FINANCIAL HLD. - Daily