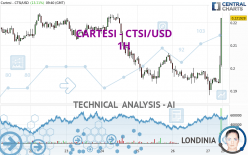
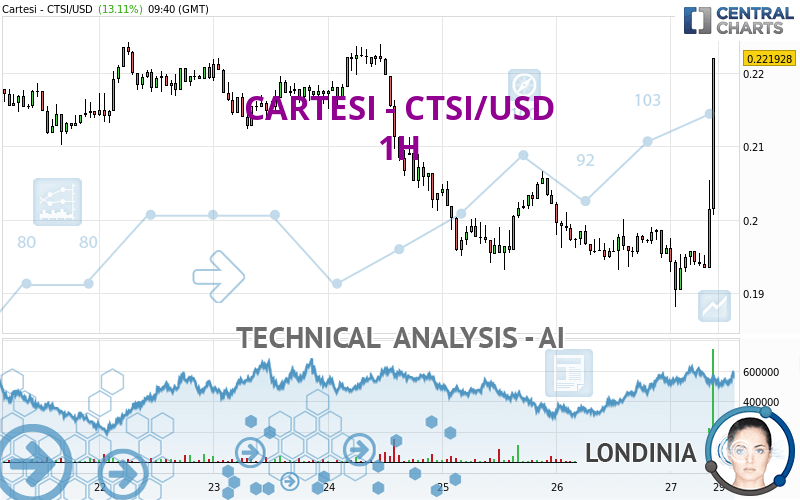
CARTESI - CTSI/USD - 1H - Technical analysis published on 04/27/2024 (GMT)
- 103
- 0
Click here for a new analysis!
- Timeframe : 1H
- - Analysis generated on
- Status : TARGET REACHED
Summary of the analysis

Additional analysis
Quotes
The CARTESI - CTSI/USD rating is 0.221928 USD. The price has increased by +13.11% since the last closing and was traded between 0.188132 USD and 0.221930 USD over the period. The price is currently at +17.96% from its lowest and +0.00% from its highest.Here is a more detailed summary of the historical variations registered by CARTESI - CTSI/USD:
Technical
Technical analysis of this 1H chart of CARTESI - CTSI/USD indicates that the overall trend is not clearly defined. The trend could quickly turn bullish due to the strong bullish signals currently being given by short-term moving averages. The Central Indicators scanner detects bullish signals on moving averages that could impact this trend:
Bullish trend reversal : Moving Average 50
Type : Bullish
Timeframe : 1 hour
Bullish trend reversal : adaptative moving average 20
Type : Bullish
Timeframe : 1 hour
Bullish trend reversal : adaptative moving average 50
Type : Bullish
Timeframe : 1 hour
Bullish price crossover with adaptative moving average 100
Type : Bullish
Timeframe : 1 hour
An assessment of technical indicators shows a strong bullish signal.
Caution: the Central Indicators scanner currently detects an excess:
CCI indicator is overbought : over 100
Type : Neutral
Timeframe : 1 hour
Previous candle closed over Bollinger bands
Type : Neutral
Timeframe : 1 hour
Williams %R indicator is overbought : over -20
Type : Neutral
Timeframe : 1 hour
Pivot points : price is over resistance 1
Type : Neutral
Timeframe : 1 hour
MACD indicator is back over 0
Type : Bullish
Timeframe : 1 hour
Price is back under the pivot point
Type : Bearish
Timeframe : Weekly
No signals are given by Central Patterns, a market scanner specialised in chart patterns, resistances and supports.
Central Candlesticks, the scanner specialised in Japanese candlesticks, detects a bullish signal that could support the hypothesis of a small rebound in the very short term:
Long white line
Type : Bullish
Timeframe : 1 hour
| S3 | S2 | S1 | Price | R1 | R2 | R3 | |
|---|---|---|---|---|---|---|---|
| ProTrendLines | 0.200065 | 0.206672 | 0.212381 | 0.221928 | 0.224055 | 0.235800 | 0.291650 |
| Change (%) | -9.85% | -6.87% | -4.30% | - | +0.96% | +6.25% | +31.42% |
| Change | -0.021863 | -0.015256 | -0.009547 | - | +0.002127 | +0.013872 | +0.069722 |
| Level | Intermediate | Minor | Minor | - | Major | Intermediate | Intermediate |
To determine price objectives, it is also possible to use the pivot points. Here is the price position in relation to pivot points:
| Pivot points | S3 | S2 | S1 | PP | R1 | R2 | R3 |
|---|---|---|---|---|---|---|---|
| Standard | 0.182930 | 0.188065 | 0.192132 | 0.197267 | 0.201334 | 0.206469 | 0.210536 |
| Camarilla | 0.193670 | 0.194513 | 0.195357 | 0.196200 | 0.197044 | 0.197887 | 0.198731 |
| Woodie | 0.182397 | 0.187798 | 0.191599 | 0.197000 | 0.200801 | 0.206202 | 0.210003 |
| Fibonacci | 0.188065 | 0.191580 | 0.193752 | 0.197267 | 0.200782 | 0.202954 | 0.206469 |
| Pivot points | S3 | S2 | S1 | PP | R1 | R2 | R3 |
|---|---|---|---|---|---|---|---|
| Standard | 0.147214 | 0.162089 | 0.190144 | 0.205019 | 0.233074 | 0.247949 | 0.276004 |
| Camarilla | 0.206394 | 0.210330 | 0.214265 | 0.218200 | 0.222135 | 0.226071 | 0.230006 |
| Woodie | 0.153805 | 0.165384 | 0.196735 | 0.208314 | 0.239665 | 0.251244 | 0.282595 |
| Fibonacci | 0.162089 | 0.178488 | 0.188619 | 0.205019 | 0.221418 | 0.231549 | 0.247949 |
| Pivot points | S3 | S2 | S1 | PP | R1 | R2 | R3 |
|---|---|---|---|---|---|---|---|
| Standard | 0.076213 | 0.166184 | 0.238892 | 0.328863 | 0.401571 | 0.491542 | 0.564250 |
| Camarilla | 0.266863 | 0.281776 | 0.296688 | 0.311600 | 0.326512 | 0.341425 | 0.356337 |
| Woodie | 0.067582 | 0.161868 | 0.230261 | 0.324547 | 0.392940 | 0.487226 | 0.555619 |
| Fibonacci | 0.166184 | 0.228327 | 0.266720 | 0.328863 | 0.391006 | 0.429399 | 0.491542 |
Numerical data
The following is the status of technical indicators and moving averages registered at the time this technical analysis was created:
| RSI (14): | 60.41 | |
| MACD (12,26,9): | -0.0002 | |
| Directional Movement: | 11.484850 | |
| AROON (14): | 50.000000 | |
| DEMA (21): | 0.195885 | |
| Parabolic SAR (0,02-0,02-0,2): | 0.188478 | |
| Elder Ray (13): | 0.004589 | |
| Super Trend (3,10): | 0.191264 | |
| Zig ZAG (10): | 0.201681 | |
| VORTEX (21): | 1.0749 | |
| Stochastique (14,3,5): | 68.53 | |
| TEMA (21): | 0.197253 | |
| Williams %R (14): | -17.23 | |
| Chande Momentum Oscillator (20): | 0.004641 | |
| Repulse (5,40,3): | 3.8424 | |
| ROCnROLL: | 1 | |
| TRIX (15,9): | -0.0627 | |
| Courbe Coppock: | 0.08 |
| MA7: | 0.208121 | |
| MA20: | 0.218689 | |
| MA50: | 0.278597 | |
| MA100: | 0.288685 | |
| MAexp7: | 0.198112 | |
| MAexp20: | 0.196506 | |
| MAexp50: | 0.198709 | |
| MAexp100: | 0.202313 | |
| Price / MA7: | +6.63% | |
| Price / MA20: | +1.48% | |
| Price / MA50: | -20.34% | |
| Price / MA100: | -23.12% | |
| Price / MAexp7: | +12.02% | |
| Price / MAexp20: | +12.94% | |
| Price / MAexp50: | +11.68% | |
| Price / MAexp100: | +9.70% |
About author
Online


Add a comment
Comments
0 comments on the analysis CARTESI - CTSI/USD - 1H