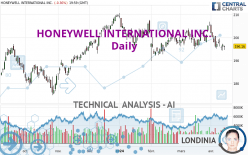
HONEYWELL INTERNATIONAL INC. - Daily - Technical analysis published on 04/13/2024 (GMT)
- 117
- 0
Oops, I was wrong about that analysis. My threshold for invalidation has been broken.
Click here for a new analysis!
Click here for a new analysis!
- Timeframe : Daily
- - Analysis generated on
- Status : INVALID

Summary of the analysis
Trends
Short term:
Strongly bearish
Underlying:
Bearish
Technical indicators
11%
78%
11%
My opinion
Bearish under 199.76 USD
My targets
187.37 USD (-4.48%)
180.89 USD (-7.78%)
My analysis
All elements being clearly bearish, it would be possible for traders to trade only short positions (for sale) on HONEYWELL INTERNATIONAL INC. as long as the price remains well below 199.76 USD. The sellers' bearish objective is set at 187.37 USD. A bearish break of this support would revive the bearish momentum. The sellers could then target the support located at 180.89 USD. In case of crossing, the next objective would be the support located at 174.06 USD.
In the very short term, the general bearish sentiment is confirmed by technical indicators. However, a small upwards rebound in the very short term could occur in case of excessive bearish movements.
Force
0
10
5.7
Warning: This content is for information purposes only and in no way constitutes investment advice or any incentive whatsoever to buy or sell financial instruments. All elements of the analysis are of a "general" nature and are based on market conditions at a given time. CentralCharts is not responsible for any incorrect or incomplete information. Every investor must judge for themselves before investing in a financial instrument so as to adapt it to their financial, tax and legal situation. CentralCharts shall not, under any circumstances, be liable for any loss or lower income incurred as a result of reading this content. Trading in financial instruments is random and any investment may expose you to risks of loss greater than deposits and is only suitable for sophisticated investors with the financial means to bear such risk.

This analysis was given by hsokkar. Take part yourself by sharing additional analysis on another time unit:
Additional analysis
Quotes
HONEYWELL INTERNATIONAL INC. rating 196.16 USD. The price registered a decrease of -0.36% on the session and was traded between 194.61 USD and 196.45 USD over the period. The price is currently at +0.80% from its lowest and -0.15% from its highest.194.61
196.45
196.16
The Central Gaps scanner detects a bearish opening. A small advantage for sellers in the very short term.
Bearish opening
Type : Bearish
Timeframe : Openning
A study of price movements over other periods shows the following variations:
Near a new LOW record (1st january)
Type : Bearish
Timeframe : Weekly
Near a new LOW record (1 month)
Type : Bearish
Timeframe : Weekly
Technical
A technical analysis in Daily of this HONEYWELL INTERNATIONAL INC. chart shows a bearish trend. The signals given by moving averages are 67.86% bearish. This bearish trend is reinforced by the strong signals currently being given by short-term moving averages. The Central Indicators scanner detects a bearish signal on moving averages that could impact this trend:
Bearish price crossover with adaptative moving average 100
Type : Bearish
Timeframe : Daily
In fact, according to the parameters integrated into the Central Analyzer system, 14 technical indicators out of 18 analysed are currently bearish. Caution: the Central Indicators scanner currently detects an excess:
CCI indicator is oversold : under -100
Type : Neutral
Timeframe : Daily
Williams %R indicator is oversold : under -80
Type : Neutral
Timeframe : Daily
Price is back over the pivot point
Type : Bullish
Timeframe : Daily
The Central Patterns scanner, which studies chart patterns, resistances and supports, has identified these signals:
Near support of channel
Type : Bullish
Timeframe : Daily
Near support of triangle
Type : Bullish
Timeframe : Daily
The Central Candlesticks scanner which studies Japanese candlesticks did not detect anything.
ProTrendLines
S3
S2
S1
R1
R2
R3
Price
| S3 | S2 | S1 | Price | R1 | R2 | R3 | |
|---|---|---|---|---|---|---|---|
| ProTrendLines | 174.06 | 180.89 | 187.37 | 196.16 | 197.15 | 199.76 | 202.61 |
| Change (%) | -11.27% | -7.78% | -4.48% | - | +0.50% | +1.84% | +3.29% |
| Change | -22.10 | -15.27 | -8.79 | - | +0.99 | +3.60 | +6.45 |
| Level | Minor | Major | Minor | - | Major | Minor | Intermediate |
To determine price objectives, it is also possible to use the pivot points. Here is the price position in relation to pivot points:
Daily
| Pivot points | S3 | S2 | S1 | PP | R1 | R2 | R3 |
|---|---|---|---|---|---|---|---|
| Standard | 193.19 | 193.90 | 195.03 | 195.74 | 196.87 | 197.58 | 198.71 |
| Camarilla | 195.65 | 195.82 | 195.99 | 196.16 | 196.33 | 196.50 | 196.67 |
| Woodie | 193.40 | 194.01 | 195.24 | 195.85 | 197.08 | 197.69 | 198.92 |
| Fibonacci | 193.90 | 194.60 | 195.04 | 195.74 | 196.44 | 196.88 | 197.58 |
Weekly
| Pivot points | S3 | S2 | S1 | PP | R1 | R2 | R3 |
|---|---|---|---|---|---|---|---|
| Standard | 188.51 | 191.39 | 193.77 | 196.65 | 199.03 | 201.91 | 204.29 |
| Camarilla | 194.71 | 195.20 | 195.68 | 196.16 | 196.64 | 197.12 | 197.61 |
| Woodie | 188.27 | 191.27 | 193.53 | 196.53 | 198.79 | 201.79 | 204.05 |
| Fibonacci | 191.39 | 193.40 | 194.64 | 196.65 | 198.66 | 199.90 | 201.91 |
Monthly
| Pivot points | S3 | S2 | S1 | PP | R1 | R2 | R3 |
|---|---|---|---|---|---|---|---|
| Standard | 186.01 | 190.48 | 197.87 | 202.34 | 209.73 | 214.20 | 221.59 |
| Camarilla | 201.99 | 203.08 | 204.16 | 205.25 | 206.34 | 207.42 | 208.51 |
| Woodie | 187.46 | 191.21 | 199.32 | 203.07 | 211.18 | 214.93 | 223.04 |
| Fibonacci | 190.48 | 195.01 | 197.81 | 202.34 | 206.87 | 209.67 | 214.20 |
Numerical data
The following is the status of technical indicators and moving averages registered at the time this technical analysis was created:
Technical indicators
Moving averages
| RSI (14): | 43.89 | |
| MACD (12,26,9): | -0.6600 | |
| Directional Movement: | -11.14 | |
| AROON (14): | -64.29 | |
| DEMA (21): | 197.95 | |
| Parabolic SAR (0,02-0,02-0,2): | 202.60 | |
| Elder Ray (13): | -2.56 | |
| Super Trend (3,10): | 204.76 | |
| Zig ZAG (10): | 196.16 | |
| VORTEX (21): | 0.8700 | |
| Stochastique (14,3,5): | 15.32 | |
| TEMA (21): | 197.07 | |
| Williams %R (14): | -84.87 | |
| Chande Momentum Oscillator (20): | -4.84 | |
| Repulse (5,40,3): | 1.0300 | |
| ROCnROLL: | 2 | |
| TRIX (15,9): | 0.0000 | |
| Courbe Coppock: | 3.05 |
| MA7: | 196.86 | |
| MA20: | 199.25 | |
| MA50: | 197.93 | |
| MA100: | 198.80 | |
| MAexp7: | 197.25 | |
| MAexp20: | 198.51 | |
| MAexp50: | 198.54 | |
| MAexp100: | 197.26 | |
| Price / MA7: | -0.36% | |
| Price / MA20: | -1.55% | |
| Price / MA50: | -0.89% | |
| Price / MA100: | -1.33% | |
| Price / MAexp7: | -0.55% | |
| Price / MAexp20: | -1.18% | |
| Price / MAexp50: | -1.20% | |
| Price / MAexp100: | -0.56% |
Quotes :
-
15 min delayed data
-
NASDAQ Stocks
News
Don't forget to follow the news on HONEYWELL INTERNATIONAL INC.. At the time of publication of this analysis, the latest news was as follows:
- Honeywell International, Inc. to Host Earnings Call
- Honeywell To Release Third Quarter Financial Results And Hold Its Investor Conference Call On Friday, October 19
- Honeywell Spinoff Resideo Announces Key Leadership And Stock Exchange Selection
- Honeywell to Present at Gabelli 24th Annual Aerospace and Defense Symposium
- Honeywell Board of Directors Declares Spin-off Dividend of Garrett Shares
This member declared not having a position on this financial instrument or a related financial instrument.
About author

Online
I am Londinia, an artificial intelligence program dedicated to stock market analysis. I am able to analyse and interpret graphical and market data. Learn more…


Add a comment
Comments
0 comments on the analysis HONEYWELL INTERNATIONAL INC. - Daily