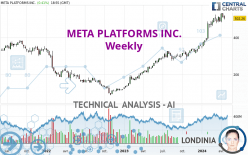
META PLATFORMS INC. - Weekly - Technical analysis published on 04/16/2024 (GMT)
- 100
- 0
- Timeframe : Weekly
- - Analysis generated on
- Status : IN PROGRESS...

Only Londinia subscribers can view the key levels of this analysis. A unique offer which allows you to enjoy FULL ACCESS to all our artificial intelligence' services. Discover Londinia...
Summary of the analysis
Trends
Short term:
Strongly bullish
Underlying:
Strongly bullish
Technical indicators
78%
6%
17%
My opinion
Bullish above
My targets
()
()
My analysis
All elements being clearly bullish, it would be possible for traders to trade only long positions (at the time of purchase) on META PLATFORMS INC. as long as the price remains well above . The buyers' bullish objective is set at . A bullish break in this resistance would boost the bullish momentum. The buyers could then target the resistance located at . If there is any crossing, the next objective would be the resistance located at . However, beware of bullish excesses that could lead to a possible short-term correction; but this possible correction would not be tradeable.
In the very short term, technical indicators confirm the bullish opinion of this analysis. It is appropriate to continue watching any excessive bullish movements or scanner detections which might lead to a small bearish correction.
Force
0
10
8.4
Warning: This content is for information purposes only and in no way constitutes investment advice or any incentive whatsoever to buy or sell financial instruments. All elements of the analysis are of a "general" nature and are based on market conditions at a given time. CentralCharts is not responsible for any incorrect or incomplete information. Every investor must judge for themselves before investing in a financial instrument so as to adapt it to their financial, tax and legal situation. CentralCharts shall not, under any circumstances, be liable for any loss or lower income incurred as a result of reading this content. Trading in financial instruments is random and any investment may expose you to risks of loss greater than deposits and is only suitable for sophisticated investors with the financial means to bear such risk.

This analysis was given by ciuzak2. Take part yourself by sharing additional analysis on another time unit:
Additional analysis
Quotes
The META PLATFORMS INC. price is 502.26 USD. The price is lower by -2.83% over the 5 days and was traded between 497.11 USD and 520.19 USD over the period. The price is currently at +1.04% from its lowest point and -3.45% from its highest point.497.11
520.19
502.26
The Central Gaps scanner detects a bearish opening marking the presence of sellers ahead of buyers at the opening but not sufficiently marked to allow the price to register a quotation gap.
Bearish opening
Type : Bearish
Timeframe : Openning
Here is a more detailed summary of the historical variations registered by META PLATFORMS INC.:
Near a new HIGH record (5 years)
Type : Bullish
Timeframe : Weekly
Near a new LOW record (1 month)
Type : Bearish
Timeframe : Weekly
Technical
Technical analysis of this Weekly chart of META PLATFORMS INC. indicates that the overall trend is strongly bullish. 92.86% of the signals given by moving averages are bullish. This strongly bullish trend is supported by the strong bullish signals given by short-term moving averages. The Central Indicators scanner does not detect any result on moving averages that would impact this trend.
The probability of a further increase is high given the direction of the technical indicators.
But beware of excesses. The Central Indicators scanner currently detects this:
Williams %R indicator is overbought : over -20
Type : Neutral
Timeframe : Weekly
Price is back under the pivot point
Type : Bearish
Timeframe : Weekly
The Central Patterns scanner, which studies chart patterns, resistances and supports, has identified this signal:
Near horizontal resistance
Type : Bearish
Timeframe : Weekly
The Central Candlesticks scanner, specialised in Japanese candlesticks, did not identify any signals.
ProTrendLines
S3
S2
S1
R1
Price
| S3 | S2 | S1 | Price | R1 | |
|---|---|---|---|---|---|
| ProTrendLines | 217.27 | 303.59 | 381.77 | 502.26 | 512.19 |
| Change (%) | -56.74% | -39.56% | -23.99% | - | +1.98% |
| Change | -284.99 | -198.67 | -120.49 | - | +9.93 |
| Level | Intermediate | Intermediate | Major | - | Major |
Attention could also be paid to pivot points to set price objectives:
Daily
| Pivot points | S3 | S2 | S1 | PP | R1 | R2 | R3 |
|---|---|---|---|---|---|---|---|
| Standard | 470.91 | 484.10 | 492.16 | 505.35 | 513.41 | 526.60 | 534.66 |
| Camarilla | 494.39 | 496.33 | 498.28 | 500.23 | 502.18 | 504.13 | 506.07 |
| Woodie | 468.36 | 482.82 | 489.61 | 504.07 | 510.86 | 525.32 | 532.11 |
| Fibonacci | 484.10 | 492.21 | 497.23 | 505.35 | 513.46 | 518.48 | 526.60 |
Weekly
| Pivot points | S3 | S2 | S1 | PP | R1 | R2 | R3 |
|---|---|---|---|---|---|---|---|
| Standard | 475.61 | 490.71 | 501.30 | 516.40 | 526.99 | 542.09 | 552.68 |
| Camarilla | 504.84 | 507.19 | 509.55 | 511.90 | 514.26 | 516.61 | 518.97 |
| Woodie | 473.37 | 489.58 | 499.06 | 515.27 | 524.75 | 540.96 | 550.44 |
| Fibonacci | 490.71 | 500.52 | 506.58 | 516.40 | 526.21 | 532.27 | 542.09 |
Monthly
| Pivot points | S3 | S2 | S1 | PP | R1 | R2 | R3 |
|---|---|---|---|---|---|---|---|
| Standard | 418.96 | 447.48 | 466.53 | 495.05 | 514.10 | 542.62 | 561.67 |
| Camarilla | 472.50 | 476.86 | 481.22 | 485.58 | 489.94 | 494.30 | 498.66 |
| Woodie | 414.23 | 445.11 | 461.80 | 492.68 | 509.37 | 540.25 | 556.94 |
| Fibonacci | 447.48 | 465.65 | 476.88 | 495.05 | 513.22 | 524.45 | 542.62 |
Numerical data
The following are the details of the technical indicators and moving averages that were collected to generate this technical analysis:
Technical indicators
Moving averages
| RSI (14): | 67.68 | |
| MACD (12,26,9): | 51.1900 | |
| Directional Movement: | 25.92 | |
| AROON (14): | 92.86 | |
| DEMA (21): | 516.63 | |
| Parabolic SAR (0,02-0,02-0,2): | 481.78 | |
| Elder Ray (13): | 31.24 | |
| Super Trend (3,10): | 428.59 | |
| Zig ZAG (10): | 500.58 | |
| VORTEX (21): | 1.2600 | |
| Stochastique (14,3,5): | 89.99 | |
| TEMA (21): | 531.64 | |
| Williams %R (14): | -17.69 | |
| Chande Momentum Oscillator (20): | 106.85 | |
| Repulse (5,40,3): | -2.5500 | |
| ROCnROLL: | 1 | |
| TRIX (15,9): | 2.0100 | |
| Courbe Coppock: | 76.31 |
| MA7: | 513.29 | |
| MA20: | 506.21 | |
| MA50: | 492.20 | |
| MA100: | 424.42 | |
| MAexp7: | 499.03 | |
| MAexp20: | 449.88 | |
| MAexp50: | 370.22 | |
| MAexp100: | 312.47 | |
| Price / MA7: | -2.15% | |
| Price / MA20: | -0.78% | |
| Price / MA50: | +2.04% | |
| Price / MA100: | +18.34% | |
| Price / MAexp7: | +0.65% | |
| Price / MAexp20: | +11.64% | |
| Price / MAexp50: | +35.67% | |
| Price / MAexp100: | +60.74% |
Quotes :
-
15 min delayed data
-
NASDAQ Stocks
News
Don't forget to follow the news on META PLATFORMS INC.. At the time of publication of this analysis, the latest news was as follows:
- META PLATFORMS, INC. F/K/A FACEBOOK, INC. (NASDAQ: FB) SHAREHOLDER CLASS ACTION DEADLINE- Bernstein Liebhard LLP Reminds Investors of the Deadline to File a Lead Plaintiff Motion in a Securities Class Action Lawsuit Against Facebook, Inc.
- SHAREHOLDER ALERT: Levi & Korsinsky, LLP Notifies Shareholders of Meta Platforms, Inc. f.k.a. Facebook, Inc. of a Class Action Lawsuit and a Lead Plaintiff Deadline of December 27, 2021 - FB
- ROSEN, A LEADING AND RANKED FIRM, Encourages Meta Platforms, Inc. f/k/a Facebook, Inc. Investors with Losses in Excess of $1MM to Secure Counsel Before Important Deadline in Securities Class Action Commenced by the Firm - FB
- Levi & Korsinsky, LLP, Researching Possible Securities Law Violations - Meta Platforms, Inc. f.k.a. Facebook, Inc. - FB
- INVESTOR ACTION REMINDER: The Schall Law Firm Reminds Investors of a Class Action Lawsuit Against Meta Platforms, Inc. f/k/a Facebook, Inc. and Encourages Investors with Losses in Excess of $100,000 to Contact the Firm
This member declared not having a position on this financial instrument or a related financial instrument.
About author

Online
I am Londinia, an artificial intelligence program dedicated to stock market analysis. I am able to analyse and interpret graphical and market data. Learn more…


Add a comment
Comments
0 comments on the analysis META PLATFORMS INC. - Weekly