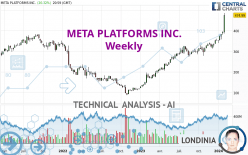
META PLATFORMS INC. - Weekly - Technical analysis published on 02/03/2024 (GMT)
- 138
- 0
Click here for a new analysis!
- Timeframe : Weekly
- - Analysis generated on
- Status : TARGET REACHED

Summary of the analysis

Additional analysis
Quotes
META PLATFORMS INC. rating 474.99 USD. Over 5 days, this instrument gained +20.51% and has been traded over the last 5 days between 387.10 USD and 485.96 USD. This implies that the 5 day price is +22.70% from its lowest point and -2.26% from its highest point.The Central Gaps scanner detects the formation of a bullish gap marking the strong presence of buyers against sellers at the opening. This formed a quotation gap.
Opening Gap UP
Type : Bullish
Timeframe : Openning
So that you have an overall view of the price change, here is a table showing the variations over several periods:
New HIGH record (5 years)
Type : Bullish
Timeframe : Weekly
New HIGH record (1 year)
Type : Bullish
Timeframe : Weekly
New HIGH record (1st january)
Type : Bullish
Timeframe : Weekly
New HIGH record (1 month)
Type : Bullish
Timeframe : Weekly
Technical
Technical analysis of META PLATFORMS INC. in Weekly shows a strongly overall bullish trend. 92.86% of the signals given by moving averages are bullish. The overall trend is supported by the strong bullish signals from short-term moving averages. The Central Indicators market scanner currently does not detect any result that concerns moving averages.
In fact, according to the parameters integrated into the Central Analyzer system, 17 technical indicators out of 18 analysed are currently bullish. Caution: the Central Indicators scanner currently detects an excess:
RSI indicator is overbought : over 80
Type : Neutral
Timeframe : Weekly
CCI indicator is overbought : over 100
Type : Neutral
Timeframe : Weekly
Williams %R indicator is overbought : over -20
Type : Neutral
Timeframe : Weekly
Pivot points : price is over resistance 3
Type : Neutral
Timeframe : Weekly
An analysis of the price chart with the Central Patterns scanner (detector of chart patterns and resistances and supports) shows a result that can have an impact on the price change:
Resistance of channel is broken
Type : Bullish
Timeframe : Weekly
The presence of a bullish Japanese candlestick pattern detected by Central Candlesticks that could cause a very short term rebound was also detected:
Long white line
Type : Bullish
Timeframe : Weekly
| S3 | S2 | S1 | Price | |
|---|---|---|---|---|
| ProTrendLines | 246.48 | 303.91 | 382.18 | 474.99 |
| Change (%) | -48.11% | -36.02% | -19.54% | - |
| Change | -228.51 | -171.08 | -92.81 | - |
| Level | Major | Minor | Major | - |
Attention could also be paid to pivot points to set price objectives:
| Pivot points | S3 | S2 | S1 | PP | R1 | R2 | R3 |
|---|---|---|---|---|---|---|---|
| Standard | 423.73 | 438.37 | 456.68 | 471.32 | 489.63 | 504.27 | 522.58 |
| Camarilla | 465.93 | 468.95 | 471.97 | 474.99 | 478.01 | 481.03 | 484.05 |
| Woodie | 425.57 | 439.29 | 458.52 | 472.24 | 491.47 | 505.19 | 524.42 |
| Fibonacci | 438.37 | 450.96 | 458.73 | 471.32 | 483.91 | 491.68 | 504.27 |
| Pivot points | S3 | S2 | S1 | PP | R1 | R2 | R3 |
|---|---|---|---|---|---|---|---|
| Standard | 368.97 | 375.07 | 384.60 | 390.70 | 400.23 | 406.33 | 415.86 |
| Camarilla | 389.84 | 391.28 | 392.71 | 394.14 | 395.57 | 397.01 | 398.44 |
| Woodie | 370.70 | 375.93 | 386.33 | 391.56 | 401.96 | 407.19 | 417.59 |
| Fibonacci | 375.07 | 381.04 | 384.73 | 390.70 | 396.67 | 400.36 | 406.33 |
| Pivot points | S3 | S2 | S1 | PP | R1 | R2 | R3 |
|---|---|---|---|---|---|---|---|
| Standard | 284.96 | 312.49 | 351.31 | 378.84 | 417.66 | 445.19 | 484.01 |
| Camarilla | 371.89 | 377.98 | 384.06 | 390.14 | 396.22 | 402.30 | 408.39 |
| Woodie | 290.62 | 315.31 | 356.97 | 381.66 | 423.32 | 448.01 | 489.67 |
| Fibonacci | 312.49 | 337.83 | 353.49 | 378.84 | 404.18 | 419.84 | 445.19 |
Numerical data
The following are the details of the technical indicators and moving averages that were collected to generate this technical analysis:
| RSI (14): | 86.81 | |
| MACD (12,26,9): | 34.6200 | |
| Directional Movement: | 39.41 | |
| AROON (14): | 100.00 | |
| DEMA (21): | 393.69 | |
| Parabolic SAR (0,02-0,02-0,2): | 339.77 | |
| Elder Ray (13): | 67.05 | |
| Super Trend (3,10): | 355.76 | |
| Zig ZAG (10): | 474.99 | |
| VORTEX (21): | 1.1900 | |
| Stochastique (14,3,5): | 97.02 | |
| TEMA (21): | 404.96 | |
| Williams %R (14): | -5.80 | |
| Chande Momentum Oscillator (20): | 146.22 | |
| Repulse (5,40,3): | 29.7400 | |
| ROCnROLL: | 1 | |
| TRIX (15,9): | 1.2100 | |
| Courbe Coppock: | 49.32 |
| MA7: | 406.90 | |
| MA20: | 384.20 | |
| MA50: | 357.01 | |
| MA100: | 334.61 | |
| MAexp7: | 394.42 | |
| MAexp20: | 351.01 | |
| MAexp50: | 300.31 | |
| MAexp100: | 267.58 | |
| Price / MA7: | +16.73% | |
| Price / MA20: | +23.63% | |
| Price / MA50: | +33.05% | |
| Price / MA100: | +41.95% | |
| Price / MAexp7: | +20.43% | |
| Price / MAexp20: | +35.32% | |
| Price / MAexp50: | +58.17% | |
| Price / MAexp100: | +77.51% |
News
Don't forget to follow the news on META PLATFORMS INC.. At the time of publication of this analysis, the latest news was as follows:
- META PLATFORMS, INC. F/K/A FACEBOOK, INC. (NASDAQ: FB) SHAREHOLDER CLASS ACTION DEADLINE- Bernstein Liebhard LLP Reminds Investors of the Deadline to File a Lead Plaintiff Motion in a Securities Class Action Lawsuit Against Facebook, Inc.
- SHAREHOLDER ALERT: Levi & Korsinsky, LLP Notifies Shareholders of Meta Platforms, Inc. f.k.a. Facebook, Inc. of a Class Action Lawsuit and a Lead Plaintiff Deadline of December 27, 2021 - FB
- ROSEN, A LEADING AND RANKED FIRM, Encourages Meta Platforms, Inc. f/k/a Facebook, Inc. Investors with Losses in Excess of $1MM to Secure Counsel Before Important Deadline in Securities Class Action Commenced by the Firm - FB
- Levi & Korsinsky, LLP, Researching Possible Securities Law Violations - Meta Platforms, Inc. f.k.a. Facebook, Inc. - FB
- INVESTOR ACTION REMINDER: The Schall Law Firm Reminds Investors of a Class Action Lawsuit Against Meta Platforms, Inc. f/k/a Facebook, Inc. and Encourages Investors with Losses in Excess of $100,000 to Contact the Firm
About author

Online


Add a comment
Comments
0 comments on the analysis META PLATFORMS INC. - Weekly