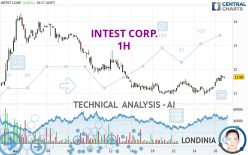
INTEST CORP. - 1H - Technical analysis published on 04/26/2024 (GMT)
- 100
- 0
Click here for a new analysis!
- Timeframe : 1H
- - Analysis generated on
- Status : INVALID

Summary of the analysis

Additional analysis
Quotes
INTEST CORP. rating 11.65 USD. The price has increased by +3.74% since the last closing and was traded between 11.29 USD and 11.76 USD over the period. The price is currently at +3.19% from its lowest and -0.94% from its highest.The Central Gaps scanner detects the formation of a bullish gap marking the strong presence of buyers against sellers at the opening. This formed a quotation gap.
Opening Gap UP
Type : Bullish
Timeframe : Openning
So that you have an overall view of the price change, here is a table showing the variations over several periods:
Near a new LOW record (1st january)
Type : Bearish
Timeframe : Weekly
Near a new LOW record (1 month)
Type : Bearish
Timeframe : Weekly
Technical
A technical analysis in 1H of this INTEST CORP. chart shows a bullish trend. 67.86% of the signals given by moving averages are bullish. This bullish trend is supported by the strong bullish signals given by short-term moving averages. There is no crossing of moving average by the price or crossing of moving averages between themselves.
Technical indicators are strongly bullish, suggesting that the price increase should continue.
But beware of excesses. The Central Indicators scanner currently detects this:
CCI indicator is overbought : over 100
Type : Neutral
Timeframe : 1 hour
Previous candle closed over Bollinger bands
Type : Neutral
Timeframe : 1 hour
Williams %R indicator is overbought : over -20
Type : Neutral
Timeframe : 1 hour
Pivot points : price is over resistance 2
Type : Neutral
Timeframe : 1 hour
Price is back over the pivot point
Type : Bullish
Timeframe : Weekly
Central Patterns, the market scanner focusing on chart patterns, resistances and supports found these results:
Near horizontal resistance
Type : Bearish
Timeframe : 1 hour
Resistance of channel is broken
Type : Bullish
Timeframe : 1 hour
The presence of these bearish patterns in Japanese candlesticks detected by Central Candlesticks that could cause a correction in the very short term were also noted
Bearish harami
Type : Bearish
Timeframe : 1 hour
Bearish harami cross
Type : Bearish
Timeframe : 1 hour
| S3 | S2 | S1 | Price | R1 | R2 | R3 | |
|---|---|---|---|---|---|---|---|
| ProTrendLines | 9.90 | 10.90 | 11.26 | 11.65 | 11.93 | 13.10 | 13.54 |
| Change (%) | -15.02% | -6.44% | -3.35% | - | +2.40% | +12.45% | +16.22% |
| Change | -1.75 | -0.75 | -0.39 | - | +0.28 | +1.45 | +1.89 |
| Level | Major | Major | Major | - | Major | Minor | Intermediate |
Pivot points can also be used to set your price objectives. Here is the price situation in relation to pivot points:
| Pivot points | S3 | S2 | S1 | PP | R1 | R2 | R3 |
|---|---|---|---|---|---|---|---|
| Standard | 10.64 | 10.78 | 11.00 | 11.14 | 11.36 | 11.50 | 11.72 |
| Camarilla | 11.13 | 11.16 | 11.20 | 11.23 | 11.26 | 11.30 | 11.33 |
| Woodie | 10.69 | 10.80 | 11.05 | 11.16 | 11.41 | 11.52 | 11.77 |
| Fibonacci | 10.78 | 10.91 | 11.00 | 11.14 | 11.27 | 11.36 | 11.50 |
| Pivot points | S3 | S2 | S1 | PP | R1 | R2 | R3 |
|---|---|---|---|---|---|---|---|
| Standard | 9.25 | 10.10 | 10.59 | 11.44 | 11.93 | 12.78 | 13.27 |
| Camarilla | 10.72 | 10.84 | 10.97 | 11.09 | 11.21 | 11.34 | 11.46 |
| Woodie | 9.08 | 10.01 | 10.42 | 11.35 | 11.76 | 12.69 | 13.10 |
| Fibonacci | 10.10 | 10.61 | 10.93 | 11.44 | 11.95 | 12.27 | 12.78 |
| Pivot points | S3 | S2 | S1 | PP | R1 | R2 | R3 |
|---|---|---|---|---|---|---|---|
| Standard | 9.02 | 9.92 | 11.58 | 12.48 | 14.14 | 15.04 | 16.70 |
| Camarilla | 12.55 | 12.78 | 13.02 | 13.25 | 13.49 | 13.72 | 13.95 |
| Woodie | 9.41 | 10.11 | 11.97 | 12.67 | 14.53 | 15.23 | 17.09 |
| Fibonacci | 9.92 | 10.90 | 11.50 | 12.48 | 13.46 | 14.06 | 15.04 |
Numerical data
The following is the status of the technical indicators and moving averages at the time of publication of this technical analysis:
| RSI (14): | 64.99 | |
| MACD (12,26,9): | 0.1100 | |
| Directional Movement: | 17.31 | |
| AROON (14): | 78.57 | |
| DEMA (21): | 11.48 | |
| Parabolic SAR (0,02-0,02-0,2): | 11.24 | |
| Elder Ray (13): | 0.25 | |
| Super Trend (3,10): | 11.22 | |
| Zig ZAG (10): | 11.71 | |
| VORTEX (21): | 1.0800 | |
| Stochastique (14,3,5): | 89.38 | |
| TEMA (21): | 11.61 | |
| Williams %R (14): | -10.59 | |
| Chande Momentum Oscillator (20): | 0.69 | |
| Repulse (5,40,3): | 1.1700 | |
| ROCnROLL: | 1 | |
| TRIX (15,9): | 0.0600 | |
| Courbe Coppock: | 7.25 |
| MA7: | 11.23 | |
| MA20: | 12.09 | |
| MA50: | 11.72 | |
| MA100: | 12.09 | |
| MAexp7: | 11.54 | |
| MAexp20: | 11.38 | |
| MAexp50: | 11.37 | |
| MAexp100: | 11.58 | |
| Price / MA7: | +3.74% | |
| Price / MA20: | -3.64% | |
| Price / MA50: | -0.60% | |
| Price / MA100: | -3.64% | |
| Price / MAexp7: | +0.95% | |
| Price / MAexp20: | +2.37% | |
| Price / MAexp50: | +2.46% | |
| Price / MAexp100: | +0.60% |
News
The latest news and videos published on INTEST CORP. at the time of the analysis were as follows:
- inTEST to Restate Third Quarter and First Nine Months 2023 Financial Statements
- inTEST Reports Record Revenue of $32.6 Million for the 2023 Second Quarter with Net Earnings Growth of 32% Year-over-Year
- inTEST Announces Second Quarter 2023 Financial Results Conference Call and Webcast on August 4
- inTEST Corporation Induction Heating Technology by Ambrell® Selected for Environmentally Preferred Approach for Preheating Application
- inTEST Corporation Set to Join Russell 2000® and 3000® Indexes
About author
Online


Add a comment
Comments
0 comments on the analysis INTEST CORP. - 1H