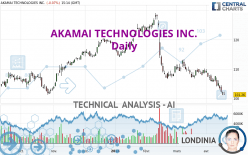
AKAMAI TECHNOLOGIES INC. - Daily - Technical analysis published on 04/17/2024 (GMT)
- 104
- 0
Click here for a new analysis!
- Timeframe : Daily
- - Analysis generated on
- Status : TARGET REACHED

Summary of the analysis

Additional analysis
Quotes
The AKAMAI TECHNOLOGIES INC. price is 101.26 USD. The price is lower by -0.07% since the last closing and was traded between 101.14 USD and 102.25 USD over the period. The price is currently at +0.12% from its lowest and -0.97% from its highest.The Central Gaps scanner detects a bullish opening. A small advantage for buyers in the very short term.
Bullish opening
Type : Bullish
Timeframe : Openning
Here is a more detailed summary of the historical variations registered by AKAMAI TECHNOLOGIES INC.:
Near a new LOW record (1st january)
Type : Bearish
Timeframe : Weekly
Near a new LOW record (1 month)
Type : Bearish
Timeframe : Weekly
Technical
Technical analysis of AKAMAI TECHNOLOGIES INC. in Daily shows a overall strongly bearish trend. 92.86% of the signals given by moving averages are bearish. The overall trend is supported by the strong bearish signals from short-term moving averages. There is no crossing of moving average by the price or crossing of moving averages between themselves.
In fact, 11 technical indicators on 18 studied are currently bearish. Caution: the Central Indicators scanner currently detects an excess:
RSI indicator is oversold : under 30
Type : Neutral
Timeframe : Daily
CCI indicator is oversold : under -100
Type : Neutral
Timeframe : Daily
CCI indicator: bullish divergence
Type : Bullish
Timeframe : Daily
Williams %R indicator is oversold : under -80
Type : Neutral
Timeframe : Daily
Pivot points : price is under support 1
Type : Neutral
Timeframe : Weekly
An analysis of the price chart with the Central Patterns scanner (detector of chart patterns and resistances and supports) shows several results that can have an impact on the price change:
Near horizontal support
Type : Bullish
Timeframe : Daily
Support of channel is broken
Type : Bearish
Timeframe : Daily
For a small rebound in the very short term, the Central Candlesticks scanner currently notes the presence of this bullish pattern in Japanese candlesticks:
Bullish harami
Type : Bullish
Timeframe : Daily
| S3 | S2 | S1 | Price | R1 | R2 | R3 | |
|---|---|---|---|---|---|---|---|
| ProTrendLines | 78.06 | 86.96 | 93.24 | 101.26 | 101.85 | 107.05 | 115.51 |
| Change (%) | -22.91% | -14.12% | -7.92% | - | +0.58% | +5.72% | +14.07% |
| Change | -23.20 | -14.30 | -8.02 | - | +0.59 | +5.79 | +14.25 |
| Level | Minor | Minor | Major | - | Intermediate | Major | Intermediate |
Attention could also be paid to pivot points to set price objectives:
| Pivot points | S3 | S2 | S1 | PP | R1 | R2 | R3 |
|---|---|---|---|---|---|---|---|
| Standard | 99.56 | 100.32 | 100.82 | 101.58 | 102.08 | 102.84 | 103.34 |
| Camarilla | 100.98 | 101.10 | 101.22 | 101.33 | 101.45 | 101.56 | 101.68 |
| Woodie | 99.44 | 100.26 | 100.70 | 101.52 | 101.96 | 102.78 | 103.22 |
| Fibonacci | 100.32 | 100.80 | 101.10 | 101.58 | 102.06 | 102.36 | 102.84 |
| Pivot points | S3 | S2 | S1 | PP | R1 | R2 | R3 |
|---|---|---|---|---|---|---|---|
| Standard | 97.08 | 100.01 | 101.74 | 104.67 | 106.40 | 109.33 | 111.06 |
| Camarilla | 102.19 | 102.62 | 103.04 | 103.47 | 103.90 | 104.32 | 104.75 |
| Woodie | 96.48 | 99.71 | 101.14 | 104.37 | 105.80 | 109.03 | 110.46 |
| Fibonacci | 100.01 | 101.79 | 102.89 | 104.67 | 106.45 | 107.55 | 109.33 |
| Pivot points | S3 | S2 | S1 | PP | R1 | R2 | R3 |
|---|---|---|---|---|---|---|---|
| Standard | 99.38 | 103.09 | 105.93 | 109.64 | 112.48 | 116.19 | 119.03 |
| Camarilla | 106.96 | 107.56 | 108.16 | 108.76 | 109.36 | 109.96 | 110.56 |
| Woodie | 98.94 | 102.87 | 105.49 | 109.42 | 112.04 | 115.97 | 118.59 |
| Fibonacci | 103.09 | 105.60 | 107.14 | 109.64 | 112.15 | 113.69 | 116.19 |
Numerical data
The following is the status of technical indicators and moving averages registered at the time this technical analysis was created:
| RSI (14): | 30.33 | |
| MACD (12,26,9): | -2.2600 | |
| Directional Movement: | -19.39 | |
| AROON (14): | -85.72 | |
| DEMA (21): | 102.95 | |
| Parabolic SAR (0,02-0,02-0,2): | 105.00 | |
| Elder Ray (13): | -2.94 | |
| Super Trend (3,10): | 107.09 | |
| Zig ZAG (10): | 101.45 | |
| VORTEX (21): | 0.7700 | |
| Stochastique (14,3,5): | 3.35 | |
| TEMA (21): | 102.39 | |
| Williams %R (14): | -96.69 | |
| Chande Momentum Oscillator (20): | -7.96 | |
| Repulse (5,40,3): | -2.5800 | |
| ROCnROLL: | 2 | |
| TRIX (15,9): | -0.2400 | |
| Courbe Coppock: | 9.77 |
| MA7: | 103.62 | |
| MA20: | 106.50 | |
| MA50: | 110.30 | |
| MA100: | 114.35 | |
| MAexp7: | 103.17 | |
| MAexp20: | 105.82 | |
| MAexp50: | 109.29 | |
| MAexp100: | 110.43 | |
| Price / MA7: | -2.28% | |
| Price / MA20: | -4.92% | |
| Price / MA50: | -8.20% | |
| Price / MA100: | -11.45% | |
| Price / MAexp7: | -1.85% | |
| Price / MAexp20: | -4.31% | |
| Price / MAexp50: | -7.35% | |
| Price / MAexp100: | -8.30% |
News
The last news published on AKAMAI TECHNOLOGIES INC. at the time of the generation of this analysis was as follows:
- Akamai Technologies To Hold First Quarter 2024 Investor Conference Call On Thursday, May 9, at 4:30 PM ET
- Akamai Expands Offerings in Hybrid DNS Infrastructure Security with Shield NS53
- Akamai Research Finds 29% of Web Attacks Target APIs
- Akamai and Neural Magic Partner to Accelerate Deep Learning AI
- Scaleflex Joins Akamai Qualified Computing Partner Program
About author
Online


Add a comment
Comments
0 comments on the analysis AKAMAI TECHNOLOGIES INC. - Daily