NXP SEMICONDUCTORS N.V. - Daily - Technical analysis published on 03/21/2021 (GMT)
- 302
- 0
Click here for a new analysis!
- Timeframe : Daily
- - Analysis generated on
- Status : INVALID

Summary of the analysis

Additional analysis
Quotes
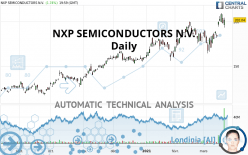
The NXP SEMICONDUCTORS N.V. rating is 202.04 USD. On the day, this instrument gained +1.74% and was traded between 193.22 USD and 204.53 USD over the period. The price is currently at +4.56% from its lowest and -1.22% from its highest.The Central Gaps scanner detects the formation of a bearish gap marking the strong presence of sellers ahead of buyers at the opening. This formed a quotation gap.
Opening Gap DOWN
Type : Bearish
Timeframe : Openning
Here is a more detailed summary of the historical variations registered by NXP SEMICONDUCTORS N.V.:
New HIGH record (5 years)
Type : Bullish
Timeframe : Weekly
Near a new HIGH record (1 year)
Type : Bullish
Timeframe : Weekly
Near a new HIGH record (1st january)
Type : Bullish
Timeframe : Weekly
Near a new HIGH record (1 month)
Type : Bullish
Timeframe : Weekly
The Central Volumes scanner notes the presence of abnormal volumes:
Abnormal volumes
Timeframe : 5 days
Abnormal volumes
Timeframe : 20 days
Technical
Technical analysis of NXP SEMICONDUCTORS N.V. in Daily shows a strongly overall bullish trend. The signals given by the moving averages are 92.86% bullish. This strong bullish trend is confirmed by the strong signals currently being given by short-term moving averages. There is no crossing of moving average by the price or crossing of moving averages between themselves.
In fact, according to the parameters integrated into the Central Analyzer system, 15 technical indicators out of 18 analysed are currently bullish. But beware of excesses. The Central Indicators scanner currently detects this:
CCI indicator is overbought : over 100
Type : Neutral
Timeframe : Daily
Previous candle closed over Bollinger bands
Type : Neutral
Timeframe : Daily
CCI indicator: bullish divergence
Type : Bullish
Timeframe : Daily
MACD indicator: bullish divergence
Type : Bullish
Timeframe : Daily
Williams %R indicator is overbought : over -20
Type : Neutral
Timeframe : Daily
Pivot points : price is over resistance 2
Type : Neutral
Timeframe : Weekly
Pivot points : price is over resistance 3
Type : Neutral
Timeframe : Daily
Pivot points : price is under support 3
Type : Neutral
Timeframe : Daily
Price is back under the pivot point
Type : Bearish
Timeframe : Weekly
Central Patterns, the market scanner focusing on chart patterns, resistances and supports found this result:
Near horizontal support
Type : Bullish
Timeframe : Daily
The Central Candlesticks scanner, specialised in Japanese candlesticks, did not identify any signals.
| S3 | S2 | S1 | Price | |
|---|---|---|---|---|
| ProTrendLines | 138.69 | 160.47 | 195.43 | 202.04 |
| Change (%) | -31.36% | -20.58% | -3.27% | - |
| Change | -63.35 | -41.57 | -6.61 | - |
| Level | Major | Intermediate | Major | - |
Pivot points can also be used to set your price objectives. Here is the price situation in relation to pivot points:
| Pivot points | S3 | S2 | S1 | PP | R1 | R2 | R3 |
|---|---|---|---|---|---|---|---|
| Standard | 184.02 | 188.62 | 195.33 | 199.93 | 206.64 | 211.24 | 217.95 |
| Camarilla | 198.93 | 199.97 | 201.00 | 202.04 | 203.08 | 204.11 | 205.15 |
| Woodie | 185.08 | 189.15 | 196.39 | 200.46 | 207.70 | 211.77 | 219.01 |
| Fibonacci | 188.62 | 192.94 | 195.61 | 199.93 | 204.25 | 206.92 | 211.24 |
| Pivot points | S3 | S2 | S1 | PP | R1 | R2 | R3 |
|---|---|---|---|---|---|---|---|
| Standard | 177.27 | 185.25 | 193.64 | 201.62 | 210.01 | 217.99 | 226.38 |
| Camarilla | 197.54 | 199.04 | 200.54 | 202.04 | 203.54 | 205.04 | 206.54 |
| Woodie | 177.49 | 185.35 | 193.86 | 201.72 | 210.23 | 218.09 | 226.60 |
| Fibonacci | 185.25 | 191.50 | 195.36 | 201.62 | 207.87 | 211.73 | 217.99 |
| Pivot points | S3 | S2 | S1 | PP | R1 | R2 | R3 |
|---|---|---|---|---|---|---|---|
| Standard | 131.21 | 148.40 | 165.20 | 182.39 | 199.19 | 216.38 | 233.18 |
| Camarilla | 172.65 | 175.77 | 178.88 | 182.00 | 185.12 | 188.23 | 191.35 |
| Woodie | 131.02 | 148.30 | 165.01 | 182.29 | 199.00 | 216.28 | 232.99 |
| Fibonacci | 148.40 | 161.38 | 169.41 | 182.39 | 195.37 | 203.40 | 216.38 |
Numerical data
The following are the details of the technical indicators and moving averages that were collected to generate this technical analysis:
| RSI (14): | 58.75 | |
| MACD (12,26,9): | 5.6800 | |
| Directional Movement: | 8.23 | |
| AROON (14): | 64.28 | |
| DEMA (21): | 196.25 | |
| Parabolic SAR (0,02-0,02-0,2): | 171.57 | |
| Elder Ray (13): | 6.13 | |
| Super Trend (3,10): | 175.27 | |
| Zig ZAG (10): | 202.04 | |
| VORTEX (21): | 0.9300 | |
| Stochastique (14,3,5): | 85.46 | |
| TEMA (21): | 198.71 | |
| Williams %R (14): | -16.63 | |
| Chande Momentum Oscillator (20): | 26.05 | |
| Repulse (5,40,3): | 3.5100 | |
| ROCnROLL: | 1 | |
| TRIX (15,9): | 0.2500 | |
| Courbe Coppock: | 16.98 |
| MA7: | 197.66 | |
| MA20: | 186.33 | |
| MA50: | 181.62 | |
| MA100: | 167.09 | |
| MAexp7: | 197.43 | |
| MAexp20: | 189.64 | |
| MAexp50: | 180.94 | |
| MAexp100: | 168.42 | |
| Price / MA7: | +2.22% | |
| Price / MA20: | +8.43% | |
| Price / MA50: | +11.24% | |
| Price / MA100: | +20.92% | |
| Price / MAexp7: | +2.34% | |
| Price / MAexp20: | +6.54% | |
| Price / MAexp50: | +11.66% | |
| Price / MAexp100: | +19.96% |
News
The latest news and videos published on NXP SEMICONDUCTORS N.V. at the time of the analysis were as follows:
- Thinking about trading options or stock in Xilinx, Moderna, NXP Semiconductors, Carnival Corp, or MGM Resorts?
- NXP Semiconductors Expands Global Use of the Workiva Platform to Gain Efficiencies and Reduce Risk
- SafeRide Technologies and NXP Semiconductors Bring Advanced Vehicle Health Monitoring to the Edge With AI-based Anomaly Detection on NXP Vehicle Network Processors
- Consolidated Research: 2018 Summary Expectations for Pacific Biosciences of California, NXP Semiconductors N.V., Consolidated Communications, Alexander & Baldwin, Willdan Group, and OneMain — Fundamental Analysis, Key Performance Indications
- Qualcomm Extends Cash Tender Offer for All Outstanding Shares of NXP
About author

Online


Add a comment
Comments
0 comments on the analysis NXP SEMICONDUCTORS N.V. - Daily