Chart pattern: Double top
-
- 1
- Who voted?
- 5902
- 0
What is a double top?
A double top is a bearish chart pattern in the shape of an "M". The price successively forms two peaks at approximately the same level, showing significant resistance.
This chart pattern shows the investors’ desire not to let the price reach new highs, and their desire to reverse the current trend.
NB: this chart pattern can also be formed in the form of "MN" or “Triple Top".
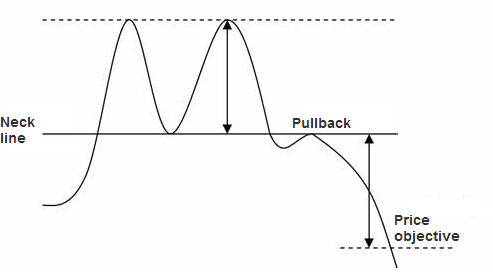
In a double top pattern, the first correction determines the neck line, marked by the lowest point between the two peaks. The price then bounces back to the level of the last highest point (same level of resistance as the first top). The magnitude of the two peaks is normally the same, but it is common for the first peak to be higher than the second (or vice versa).
A double top is only definitively validated at a bearish break in the neck line.
The price objective in a double top is calculated by plotting the pattern’s highest point above the neck line.
NB: the highest point corresponds to the difference between the neck line and the resistance line where the two peaks were formed.
When the double top pattern is validated (break in the neck line), it is common for the price to make a pullback in resistance on the neck line before reaching the pattern’s price objective.
Graphical representation of a double top
Double top statistics
- In 75% of cases, the movement is bearish after a double top.
- In 83% of cases, the price breaks the double top pattern’s neck line.
- In 71% of cases, the double top pattern’s price objective is reached when the neck line is broken.
- In 83% of cases, the bearish movement continues at the break in the double top pattern’s neck line.
- In 61% of cases, the price makes a pullback in resistance on the neck line of the double top pattern after exit.
The various double top representations
There are various double top representations, which are differentiated according to two criteria:
1 - The shape of the peak; it can be in the shape of a peak (called an Adam peak) or a rounded shape (called an Eve peak).
2 - The level of the second peak; this can be higher, at the same level or lower, than the first peak.
Notes on double tops
- Once the price objective is reached, the downward movement is generally less significant if the price has made a pullback at the pattern’s exit.
- The closer the two peaks in a double top pattern, the higher the pattern’s percentage of success.
- The larger the bullish movement preceding the formation of the double-top pattern, the more forceful the downward movement at the break in the neck line will be.
For your information: A Double Top is a reversal chart pattern. Its opposite is a Double Bottom.


