Chart pattern: Triple top
-
- 0
- 6688
- 0
What is a triple top?
A triple peak or triple top is a bearish chart pattern in the form of an MN. Three peaks follow one another, showing significant resistance. This is a sign of a tendency towards a reversal.
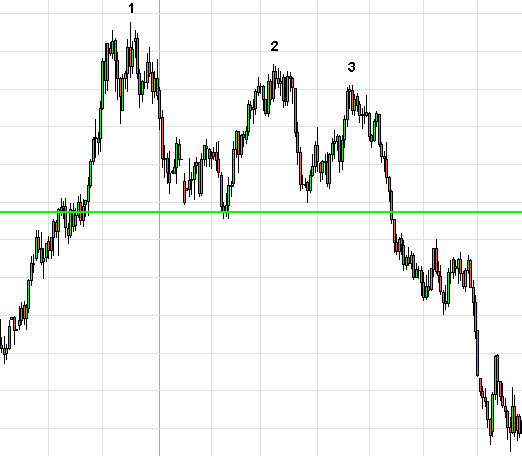
For the triple top below, the resistance zone causes a correction 3 times. The pattern’s neck line is formed by the lower of the two bearish peaks. A first correction is therefore made and then the price comes back to hit the resistance line. The magnitude of the two peaks is normally the same (as in the case below), but it can happen that the first peak is higher than the next two. This configuration reinforces the pattern’s validity since it reflects a loss of momentum in the buying current.
Be careful, if the second peak is lower than the other two, it may be a head and shoulders pattern.
There is then a second correction, theoretically at the same level as the first correction. If the neck line is broken at that moment, then it may be a double top. Therein lies the difficulty. In some cases, we only know afterwards what type of pattern we are faced with. There must be a reversal on the resistance. However, the 3rd peak may be lower than the first two, which increases the chances of reversals (exhaustion of the buying current). It is this 3rd correction that causes the neck line to break and validates the bearish reversal.
Once the neck line is broken, the price can bounce back on that line (this line then becomes the resistance line, we call this a pullback), and then returns to bearish. The price objective is determined by the distance between the resistance line and the neck line, which is symmetrically plotted against the neck line
Graphical representation of a triple top
Statistics on triple tops
Here are some statistics about triple tops:
- In 80% of cases, there is a bearish reversal
- In 85% of cases, there is a bearish exit
- In 50% of cases, the objective of the pattern is reached once the neck line is broken
- In 85% of cases, there is a continuation in the bearish movement at the break of the neck line
- In 84% of cases, a pullback intervenes at the neck line
The different types of triple tops
There are different types of triple tops that can be differentiated according to 3 criteria:
- The shape of the peak: The peak can be in the shape of an inverted V (which are called Adam troughs) or an inverted U (which are called Eve troughs).
- The level of the second peak: The second peak may be higher, at the same level or slightly lower than the first peak .
- The level of the third peak: The third peak may be higher, at the same level or lower than the second peak .
Notes on triple tops
- In case of a pullback, the bearish movement is weaker once the pattern’s objective is reached.
- If the resistance is tested at length before a correction (base of the flat peak), then the descent following the break in the neck line will be more significant
- The closer the three peaks are to each other, the greater the pattern’s % success rate
- The more direct the movements between the neck line and the resistance , the better the pattern’s performance is
- The larger the bullish movement preceding the triple top’s formation, the stronger the bearish movement at the break of the neck line will be.
- The pattern performs better if the third peak is not as deep as the first two.
Trading strategies with triple tops
The traditional strategy:
Entry: Open a short position at the break of the neck line
Stop loss: The stop loss is placed above the neck line
Objective: Theoretical objective of the pattern
Advantage: the trade has a high percentage of success
Disadvantage: Pullbacks often overshoot the neck line. As a result, a stop loss placed too close can be blindly hit. To remedy this, it is possible to wait for the pullback on the neck line before opening a position. This allows you to place your stop loss better.
The aggressive strategy:
Entry: Open a short position after the formation of the second or third peak
Stop loss: The stop loss is placed above the highest peak
Objective: Return to the neck line.
Advantage: The gain / risk ratio is high, the stop loss being placed close to the entry point
Disadvantage: The percentage loss of the trade is higher because the triple top pattern is not yet confirmed.
For your information: The Triple Top is a reversal chart pattern. Its opposite is a Triple Bottom


