Chart pattern: Pennant
-
- 1
- Who voted?
- 8211
- 0
What is a pennant?
A pennant is a continuation chart pattern that looks a lot like a symmetrical triangle, but its characteristics are different.
This chart pattern generally appears following a sudden upward or downward movement.
A pennant’s life span is short by virtue of the time frame.
The exit direction of a pennant pattern depends on the movement that preceded it. The pennant’s formation can therefore occur in a bullish or bearish trend.
A pennant’s price objective is calculated in relation to the trend that preceded its formation; generally, traders plot the full height of the movement that preceded the pennant’s formation on the pattern’s last low/high point.
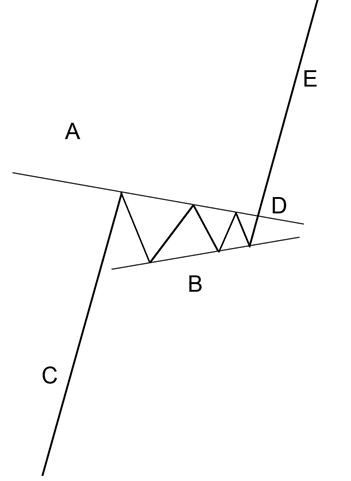
Graphical representation of a pennant
Statistics of pennant patterns
- In 75% of cases, a pennant’s exit is in the same direction as the movement preceding its formation.
- In 90% of cases, a pennant is a continuation pattern.
- In 55% of cases, a pennant pattern’s price objective is reached.
- In 16% of cases, the price makes a pullback on the pennant after exit.
Notes on pennant patterns
- The stronger the movement prior to the pennant’s formation, the stronger the movement after exit from the pennant.
- A pennant with a narrow base performs better than a pennant with a wide base
- A pennant is stronger if there are no false breaks (false pattern exits).
- Pullbacks after exit from the pennant are detrimental to the pattern’s performance.
For your information: A pennant is a continuation chart pattern.


